![]()
![]()
![]()
![]()
- Interim Update 6th May 2015
Copyright
Reminder
The commentaries that appear at TSI may not be distributed, in full or in part, without our written permission. In particular, please note that the posting of extracts from TSI commentaries at other web sites or providing links to TSI commentaries at other web sites (for example, at discussion boards) without our written permission is prohibited.
We reserve the right to immediately terminate the subscription of any TSI subscriber who distributes the TSI commentaries without our written permission.
Have government bond yields finally bottomed on a long-term basis?
Cutting to the chase, the answer
to the above question is: possibly, but it is far too soon to make a
high-confidence prediction*. However, recent bond-market action indicates that a
turning point of at least short-term significance and potentially of
intermediate-term significance happened in the first quarter of this year.
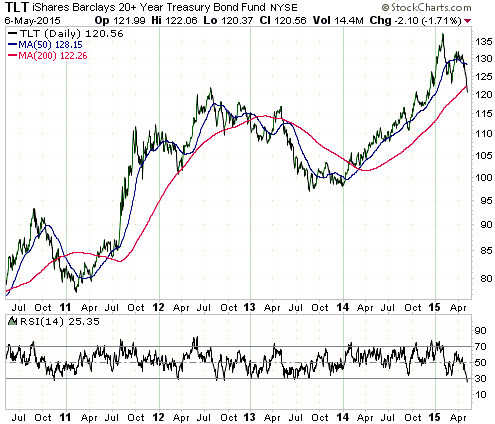
In the US, the price peak (yield trough) to date for government bonds occurred
in January with a lower price peak at the end of March. Refer to the following
daily chart of the iShares 20+ Year Treasury Bond ETF (TLT) for details.
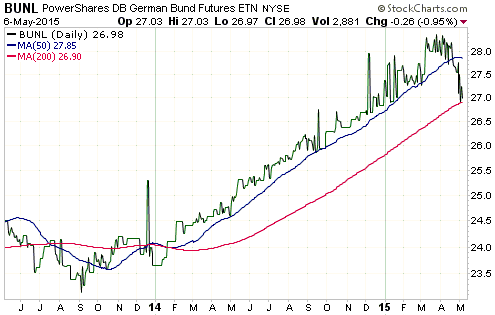
In Germany, the price peak to date for long-dated government bonds occurred
about 5 weeks ago. The subsequent sharp price decline, which is evident on the
following chart of the PowerShares DB German Bund Futures ETN (BUNL), is the
most notable directional shift since the second quarter of 2013. The price
decline has been associated with a rise in the 10-year Bund yield from
approximately zero to almost 0.6%.
The recent bond-market changes (falling prices, rising yields) have been driven
by rising inflation expectations.
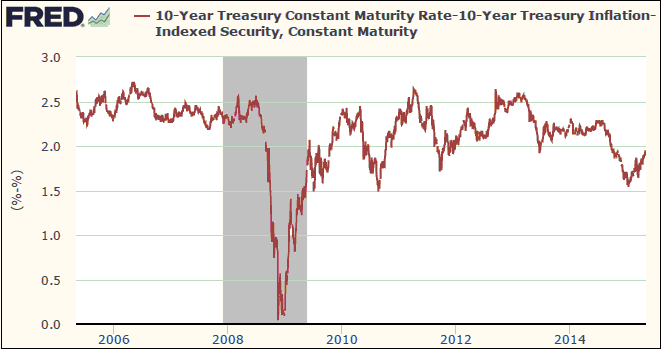
In the US, our preferred indicator of inflation expectations is what we call the
"Expected CPI", which is the difference between the yield on a standard Treasury
Note and the yield on a TIPS (Treasury Inflation-Protected Security) of the same
duration. A chart of the 10-year Expected CPI is displayed below.
As evidenced by the following chart, during the second half of last year there
was a large decline in inflation expectations to near a 5-year low. However, the
chart also shows that inflation expectations have risen by enough from their
January-2015 bottom to suggest an intermediate-term reversal to the upside.
We don't have a similar chart for Germany; however, it's a good bet that with
the ECB vowing to push ahead with its ridiculous new pro-inflation scheme
despite the current 12%+ rate of growth in euro supply and the signs of
increasing European economic activity, inflation expectations are now also on
the rise in the euro-zone.
So, is this the right time to bet against the US Treasury market?
We don't know, but it isn't a trade that currently appeals to us. It could very
well appeal to us at some point over the coming two months, but right now we are
put off by the following:
1) US government bonds offer excellent value compared to all European government
bonds.
2) TLT is short-term 'oversold' (the above chart shows that the daily RSI is at
its lowest level in years) and just below its 200-day MA (a likely spot for a
short-term bottom).
3) Sentiment indicators such as the COT data do not suggest sizable downside
risk.
A rebound over the next few weeks might prompt us to risk some money on a
bearish bond-market speculation, but we'll cross that bridge when we come to it.
*We are confident that a long-term transition from falling
to rising yields is underway, but we don't have a strong opinion on whether or
not the ultimate yield low is in place.
It's time to start buying agricultural commodities
The real prices of agricultural
commodities have been trending lower for about 200 years and the trend shows no
sign of ending. Therefore, the next time someone suggests that you buy
agricultural commodities and cites "people have gotta eat" as the reason, feel
free to laugh at them. People have always needed to eat, but this truism hasn't
prevented the real price of food from trending downward on a very long-term
basis. However, within the on-going 200+ year downward trend there are times
when it is reasonable to make a long-term financial commitment to agricultural
commodities. Those times are when the commodities are dirt cheap.
Now is such a time. Perhaps they will get a little cheaper within the next few
months, but the long-term risk/reward is now definitively skewed towards reward
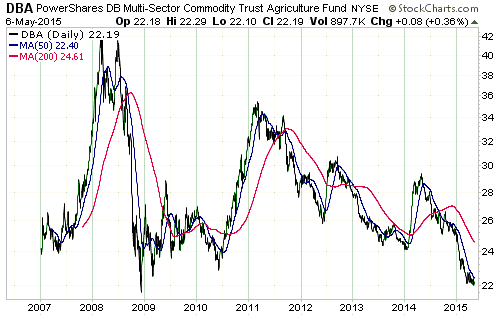
due to the extent to which prices have fallen. In particular, the first of the
following charts shows that the PowerShares DB Agriculture Fund (DBA), a proxy
for agricultural commodities such as cattle, cocoa, coffee, hogs and various
grains, is languishing near its 2008 Global Financial Crisis bottom, and the
second of the following charts shows that iPath Grains Total Return ETN (JJG) is
testing its 2008, 2010 and 2014 lows.
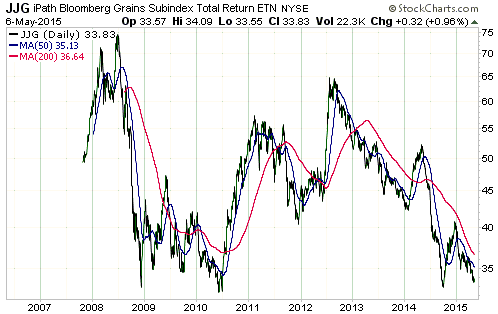
We've identified some short and intermediate-term trading opportunities in the
grains (via JJG) over the past few years, but this is the first time in many
years that we've suggested accumulating long-term exposure to agricultural
commodities.
The Stock Market
The US
Due to the recent marginal (and non-sustained) upside breaks to new multi-year
highs in some of the most influential US stock indices, it wouldn't take much
weakness from here to generate bearish price signals. However, no such signals
have yet been generated.
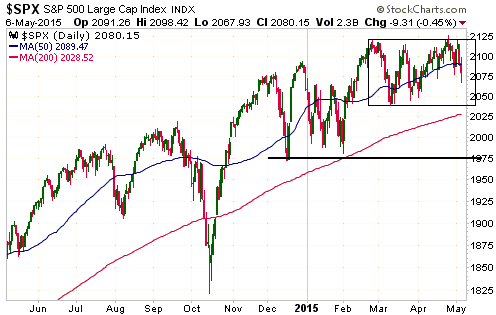
With regard to the S&P500 Index (SPX), oscillations between the March low (2039)
and the multiple highs in the 2110-2120 range can be ignored. A daily close
below the March low would be the first clear-cut sign of trouble, while a weekly
close below 1975 would be a bear-market signal.
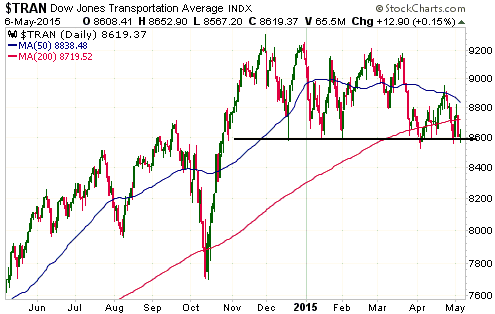
As previously advised, the first clear-cut sign of trouble is likely to come
from the Dow Transportation Average (TRAN). TRAN again dropped to support at
8600 on Tuesday, but managed to remain above this support (on a daily closing
basis) on Wednesday despite a decline in the broad market.
Gold and the Dollar
Gold
The Fundamentals
The recent rise in inflation expectations hasn't created a more bullish
fundamental backdrop for gold. The reason is that nominal T-Note yields have
risen by more than inflation expectations, leading to a small increase in real
US interest rates (always keep in mind that higher inflation expectations are
only bullish for gold to the extent that they bring about lower real interest
rates). Also, T-Note yields have risen by more than junk-bond yields, leading to
a small narrowing of credit spreads.
Rising real US interest rates and narrowing credit spreads are gold-bearish, but
these effects have been offset by a weakening Dollar Index. All things
considered, there hasn't been a significant change.
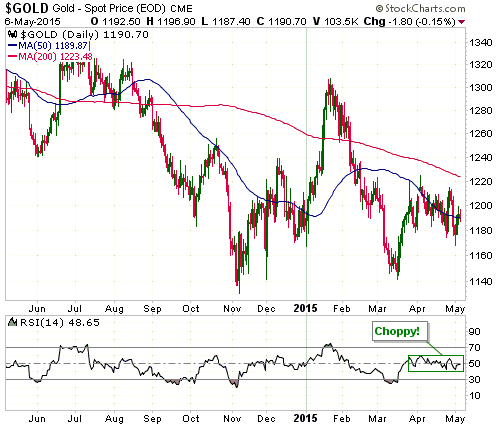
The Price Action
The US$ gold price ended last week below support at $1180, but, as discussed in
the latest Weekly Update, the performance of the gold-mining sector suggested
that there would not be any follow-through to the downside in the bullion market
during the first half of this week.
The gold price rebounded to around $1190 during the first three days of this
week, but the gold-mining sector pulled back. This is a warning not to expect
much more upside in the gold price over the days immediately ahead.
Except for those who make a living trading intra-day price swings, nothing of
consequence has happened to the US$ gold price since late-March. The price has
simply chopped back and forth, preventing the market from becoming extended to
either the upside or the downside. This is illustrated by the narrow sideways
range of gold's daily RSI, which is shown at the bottom of the following chart.
Although this week's lacklustre performance by the gold-mining sector warns not
to expect more upside in the bullion price over the days immediately ahead, the
US employment numbers due to be reported this Friday could throw the proverbial
spanner into the works for either the 'longs' or the 'shorts'. As also discussed
in the latest Weekly Update, there tends to be much greater-than-average
volatility in the gold market on Employment-Report days, with about half of
these days since the beginning of 2013 yielding daily-closing swings of at least
$20.
There's a decent chance of even more volatility than usual in reaction to the
April Employment Report, due to the fact that the March report was very weak. If
the April report is also very weak it will suggest a new trend (with obvious
implications for Fed policy), whereas if the April report shows job creation of
220K+ it will suggest that the March report was anomalous. Since there is no way
to reliably predict what the report will show, it probably makes sense for
short-term speculators to move to the sidelines ahead of the news.
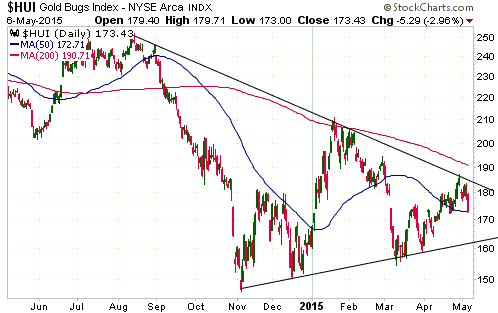
Gold Stocks
After showing resilience late last week, the gold-stock indices were 'soggy'
over the first three days of this week. Not only was the HUI unable to sustain
its break above 180, it was also unable to hold above support at 175 despite a
small increase in the gold price.
The recent price action suggests that many short-term traders have drawn lines
similar to the ones shown on the following daily chart. We thought that the
200-day MA was a likely near-term upside target, but it seems that progress is
being capped by the downward-sloping trend-line that has now reached the
low-180s.
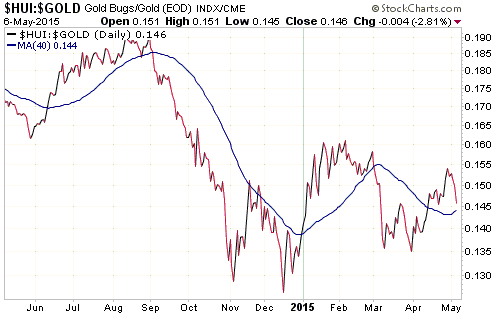
With the HUI having just pulled back in the face of a bounce in the gold price,
the HUI/gold ratio has dropped quite sharply. However, it is still above its
40-day MA, which means that it is still in a bullish position.
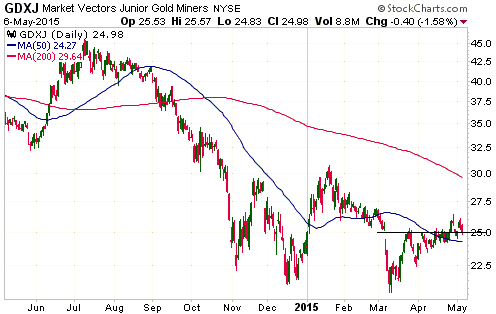
Interestingly, the juniors held up better than the seniors over the first three
days of this week, as evidenced by GDXJ essentially moving sideways and holding
support at $25.00.
The back-and-forth price action of the past few months is part of a complex
long-term bottoming pattern. It won't take much additional strength from here to
indicate that the bottoming is complete, but within this pattern there could
still be another test of last year's low. That's with regard to the HUI. Some
individual gold-mining stocks have already done enough to confirm that new
intermediate-term or long-term advances are in progress.
We have no opinion on how the gold-mining sector will trade over the remainder
of this week.
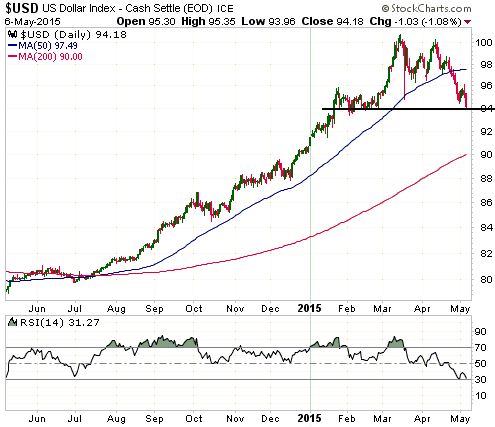
The Currency Market
The Dollar Index ended Wednesday's session precariously perched at last-ditch
support defined by the February lows. As evidenced by the RSI shown at the
bottom of the following daily chart, it is also 'oversold' on a short-term
basis.
This means that the dollar's reaction to Friday's US Employment Report will be
critical. A weekly close below 94 would strongly suggest that an
intermediate-term peak was put in place in March and that a decline to the
200-day MA would be likely prior to even a short-term bottom, whereas if the
Dollar Index can end the week above support near 94 it will keep alive the
possibility that its March-May downturn was a routine short-term correction.
As is the case with the gold market, short-term speculators in currency futures
should probably move to the sidelines prior to the release of Friday's
employment news. The stage is set for a big move, but the direction is
unpredictable.
Updates on Stock Selections
Notes: 1) To review the complete list of current TSI stock selections, logon at http://www.speculative-investor.com/new/market_logon.asp and then click on "Stock Selections" in the menu. When at the Stock Selections page, click on a stock's symbol to bring-up an archive of our comments on the stock in question. 2) The Small Stock Watch List is located at http://www.speculative-investor.com/new/smallstockwatch.html
Chart Sources
Charts appearing in today's commentary
are courtesy of:
http://stockcharts.com/index.html
http://research.stlouisfed.org/
![]()