![]()
![]()
![]()
![]()
- Interim Update 6th May 2020
Copyright
Reminder
The commentaries that appear at TSI
may not be distributed, in full or in part, without our written permission.
In particular, please note that the posting of extracts from TSI commentaries
at other web sites or providing links to TSI commentaries at other web
sites (for example, at discussion boards) without our written permission
is prohibited.
We reserve the right to immediately
terminate the subscription of any TSI subscriber who distributes the TSI
commentaries without our written permission.
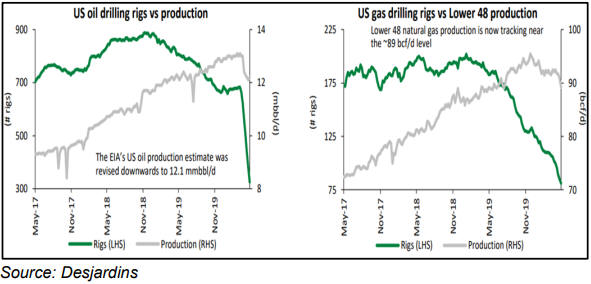
Oil and Gas (O&G)
O&G production is
adjusting to the new reality
The
latest
President's Report from Peyto (PEY.TO), a mid-tier natural gas
producer, included the following charts comparing US oil and gas (O&G)
production with the number of drilling rigs in operation. Production has
declined, but the recent collapse in the quantity of drilling rigs means
that there will be a much greater decline in production over the months
ahead.
O&G demand should begin to recover over the next few months as
businesses reopen and people return to work. This demand recovery combined
with the now-entrenched downward trend in production should mean that
production and consumption move back into balance in the not-too-distant
future, after which inventories should start being drawn down.
The
coming inventory draw-down will remove the upward pressure from oil
storage prices, but inventory levels and the associated storage costs
probably will remain elevated for at least a few more quarters.
Consequently, we expect that the oil futures market will have a
larger-than-usual contango* for many months to come and that tanker
companies will generate much better earnings than the market currently
expects over the coming 12 months.
We haven't yet 'pulled the
trigger' on the tanker trade that was discussed in the 22nd April Interim
Update and the 27th April Weekly Update, but we suspect that a good
opportunity to do so will arrive by the end of this month. The optimum
time to buy the tanker stocks probably will be around the time that the
oil price recovery 'runs out of steam'.
*Meaning
that the spot price will remain further than usual below the nearest
futures price and the nearby futures contracts will trade at
larger-than-usual discounts to contracts will later expiry dates.
The recent price action
On Monday 20th April
the world was shocked when the expiring May-2020 NYMEX oil futures
contract plunged well into negative territory. The day after this
happened, the June-2020 oil futures contract plummeted from above $20 to a
low of $6.50. A rebound then began.
The rebound in the June-2020
contract was spectacular, with the price almost quadrupling from its 21st
April low of $6.50 to its 6th May high of $26.08. Very few people would
have been able to take advantage of this dramatic recovery, though,
because the only way to do so was by purchasing oil for June-2020
delivery, which would have been a very risky thing to do for anyone who
didn't have the capacity to store the oil.
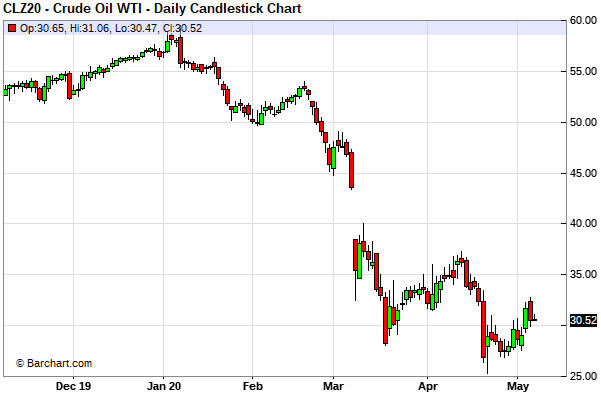
As illustrated by the
following daily chart, the rebound in the December-2020 oil futures
contract was far less substantial. This contract bottomed at $25.31 on
22nd April and has since traded as high as $32.77, for a trough to peak
gain of about 30%.
We won't be surprised if the December-2020 oil
contract moves up to the $36-$38 range within the next few weeks, but we
doubt that it will do significantly better than that before downward
forces reassert themselves.
It's possible that April-2020 will turn
out to be the cycle low for oil, but a lot will depend on the speed at
which the global economy reopens and the extent to which the stock market
retraces its March-May rebound.
We got more evidence (in the form of a sharp rise to the 200-day MA)
during the first two days of this week that the natural gas (NG) market
made a multi-month price low (potentially a cycle low) in early April. The
next pieces of the puzzle that must fall into place are a brief correction
that holds at/above the 50-day MA (currently near $1.80) and then a daily
close above the 200-day MA.
The Stock Market
Current Market Situation
The conflict between the US and China governments was 'put on the
backburner' late last year when the Phase 1 trade deal was done. It
remained a long-term risk, but it was eliminated as a short-term threat.
However, with the US government now seemingly intent on holding China's
government accountable for the COVID-19 pandemic, the conflict has
returned to centre stage.
The Trump team claims to have evidence
that the new coronavirus leaked into the wide world via an accident at a
laboratory in Wuhan, but it has not shown this evidence to any US allies
or any impartial authority. This probably means that there is no such
evidence, just reasons to be suspicious. China's government, of course,
has denied that the virus escaped from one of its own labs and is using
its giant propaganda machine to portray the Trump claim as a
politically-motivated, anti-China lie.
We have no idea what the
truth is here. First, we have no trouble believing the story that the
virus made its way into the world due to inadequate safety/security
measures at the Wuhan Institute of Virology. After all, it is a fact that
bat coronaviruses were being studied at this facility. At the same time,
the story that the virus jumped from animals to humans at a 'wet market'
in Wuhan is also very plausible. After all, history is littered with
examples of pandemics caused by viruses making the leap from animals to
humans.
Regardless of the truth, if the conflict continues to
escalate it will be, from the economy's perspective, like kicking a downed
man. It is the last thing that the US economy and the global economy need
right now.
At the moment, the stock market is ignoring the economic
risk posed by the potential escalation of the US-China conflict. It also
appears to be ignoring the fact that central bank money and credit
creation cannot replace lost production. All the central bank can do is
boost the prices at which the remaining production is sold.
At this
stage, the post-crash rebound high for the SPX is last week's high near
2950. A reversal has not been signalled yet, so last week's high could be
exceeded within the next couple of weeks. However, anything more than a
marginal break above last week's high is unlikely prior to the start of a
meaningful correction.
The start of a meaningful correction would
be confirmed by a break below the 50-day MA, but a daily close below 2800
could be taken as an early warning that a downward reversal is in the
works. A daily close below 2800 would break the SPX below its 20-day MA
and the channel drawn on the following daily chart.
A normal correction would retrace up to half of the preceding rally.
This means that if last week's high turns out to be the rebound peak then
a normal correction could result in the SPX dropping back to the 2550-2600
range.
In the latest Weekly Update we wrote that for new bearish
speculations it would make sense to focus on some of the sectors/groups
that were relatively weak during February-March. Good examples are the
transportation sector, as represented by IYT (the Transportation ETF), and
the small-cap end of the market, as represented by IWM (the Russell2000
SmallCap ETF).
The following daily chart shows that the Dow
Transportation Average (TRAN) has dropped below its 50-day MA and that the
TRAN/SPX ratio has just made a new 12-month low. This suggests that even
if the SPX experiences nothing more bearish than a normal correction
within the next couple of months, there is a good chance that TRAN will
test its March low.
The next daily chart shows that there was a sharp rise in the
Russell2000 SmallCap ETF (IWM) during the first three days of last week
that took the ETF well above its 50-day MA, and then a plunge that fully
retraced the sharp rise. It looks like a short-term top is in place for
the IWM, but as is the case with the SPX a daily close below the 50-day MA
is required to confirm a short-term trend reversal.
Bearish speculations and hedges
In the latest
Weekly Update, we wrote:
"...it would be reasonable for
experienced option traders to purchase IYT and/or IWM put options with
expiry dates in August-2020 or later during market rebounds over the
coming fortnight. Traders/investors who aren't experienced with options
could purchase bear funds or simply raise cash."
Traders/investors also could choose to tighten their stops, if that is
their preferred method of risk management.
In our own account,
there are some SPY $230 put options expiring in June-2020 that were
purchased 2-3 weeks ago and some IWM $100 put options expiring in
October-2020 that were purchased on Tuesday of this week. Our plan is to
sell the SPY puts within the next four weeks, ideally following a decline
in the SPX to 2600 or lower, and to buy more IWM put options during the
next two weeks, ideally on strong days for the underlying ETF.
In
the TSI Stocks List we have the SPY $230 put option that expires on 19th
June 2020 and we will add the IWM put option mentioned above if it trades
at US$4.00 (it ended Wednesday's session in the US$4.80s).
Note
that stocks and options are either 100% in or 100% out of the TSI List,
but when managing money it often makes sense to scale into and out of
positions. The scaling process lessens the need to be accurate with
short-term timing.
Gold and the Dollar
Gold
The
US$ gold price has pulled back to support near $1690, again. As long as
this support holds, the door will remain open to another new multi-year
high prior to a short-term top. Decisively breaching this support would
signal that a short-term top is in place.
Below is the weekly gold/SPX chart that we use as the primary
indicator of long-term gold trends. On this chart, gold bull markets are
signalled by a cross from below to above the 200-week MA (the blue line)
and gold bear markets are signalled by a cross from above to below the
200-week MA. Over the past 30 years there was one false signal, which
occurred as a result of the 1987 stock market crash.
The 200-week
MA crossover that occurred in March-2020 confirmed that a gold bull market
began in Q3-2018. Considering that this signal was the result of a
1987-style stock market crash, there is a risk that it will prove to be
false. This risk will be eliminated if gold/SPX achieves a weekly close
above its March-2020 high.
Silver
Since the second week of April the US$
silver price has drifted lower beneath its 50-day MA. From its current
level it would have to gain $1-$2 to create a short-term selling
opportunity or lose $1-$2 to create a short-term buying opportunity.
Gold Stocks
In mid-March the HUI/gold ratio
reached the bottom of a 25% moving-average envelope around its 40-day MA.
As we pointed out at the time (refer to the 16th March Weekly Update),
this suggested that a strong rebound was about to begin.
In the
27th April Weekly Update we included an update of the same chart to show
that there had been a shift of almost 180 degrees, in that the HUI/gold
ratio had almost reached the top of the same envelope. We concluded: "Although
this shows that the gold mining sector is now 'overbought' relative to
gold bullion, the historical record suggests that it is more a sign of
strength than a reason to be worried. In this respect it is similar to the
surge in the broad stock market's McClellan Oscillator."
Due
to some additional strength in the HUI relative to gold over the ensuing
1.5 weeks, the 180-degree shift is now complete. As illustrated below, the
HUI/gold ratio hit the top of its MA envelope during the first half of
this week.
On an intermediate-term basis the HUI/gold ratio's 'overbought'
condition is bullish. The historical record tells us that when the
HUI/gold ratio becomes very stretched to the upside within two months of a
multi-year low, the gold sector is in the early part of a 6-12 month
upward trend. Something similar happened in early-2016, late-2008,
early-2002 and early-2001. In each case, the HUI went on to trade much
higher within the ensuing 12 months.
On a short-term basis the gold
sector is due for a significant correction. The HUI is stretched to the
upside and testing long-term resistance defined by its 2016 top. If it
were to break above this resistance without some intervening corrective
activity then it would be even more stretched to the upside, which
obviously wouldn't improve the short-term risk/reward. On the contrary, it
would increase the risk of a failed upside breakout.
Given that the
gold sector has rallied with the broad stock market over the past several
weeks, it's reasonable to expect that gold mining stocks would get dragged
down by a sizable decline in the broad market. Not, however, to the extent
that they were dragged down during March. Due to the obviously bullish
gold mining fundamentals, we suspect that even if the SPX were to revisit
its March low within the next two months the HUI wouldn't go significantly
lower than 200.
For the HUI, a normal correction would end near
lateral support at 220 or the 50-day MA (227 and rising).
The Currency Market
The Dollar Index (DX) has
rebounded from the bottom of its recent range, but the pattern is
unchanged. A triangle continues to form.
The DX's short-term
pattern is beginning to look more like a mid-trend consolidation than a
reversal, which implies that the pattern is more likely to end in a
downside breakout than an upside breakout. A downside breakout from the
triangle would suggest a target of around 96.
As previously
mentioned, a downside breakout would be signalled by a daily close below
98.7 and an upside breakout would be signalled by a daily close above
101.0.
Updates on Stock Selections
Notes: 1) To review the complete list of current TSI stock selections, logon at
http://www.speculative-investor.com/new/market_logon.asp
and then click on "Stock Selections" in the menu. When at the Stock
Selections page, click on a stock's symbol to bring-up an archive of
our comments on the stock in question. 2) The Small Stock Watch List is
located at http://www.speculative-investor.com/new/smallstockwatch.html
Chart Sources
Charts appearing in today's commentary
are courtesy of:
https://stockcharts.com/
https://www.barchart.com/
![]()