![]()
![]()
![]()
![]()
- Interim Update 6th June 2018
Copyright
Reminder
The commentaries that appear at TSI
may not be distributed, in full or in part, without our written permission.
In particular, please note that the posting of extracts from TSI commentaries
at other web sites or providing links to TSI commentaries at other web
sites (for example, at discussion boards) without our written permission
is prohibited.
We reserve the right to immediately
terminate the subscription of any TSI subscriber who distributes the TSI
commentaries without our written permission.
Industrial metals in
rally mode
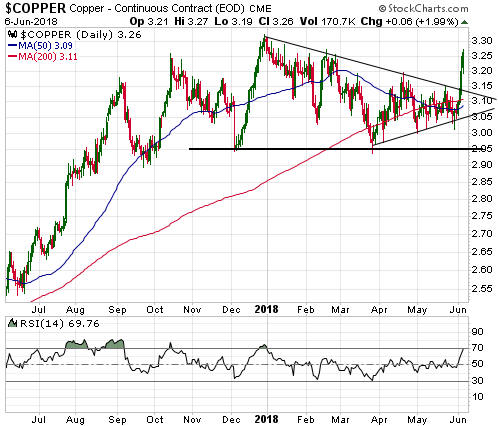
Copper breaks out to the
upside
In the 28th May Weekly Update under the heading
"The copper market is coiling", we wrote:
"The copper price is
working its way into the apex of the triangle drawn on the following daily
chart. For this coming week, a daily close above $3.15 or below $3.05
would be a breakout from this 'coiling' pattern.
A daily close
above $3.15 would suggest that copper was on its way to new multi-year
price highs. A daily close below $3.05 would point to a re-test of
intermediate-term lateral support at $2.95, but triple bottoms are rare so
it's likely that the next test of this support will fail."
The
copper price broke out of its 'coiling pattern' to the upside on Tuesday
of this week and then built on its breakout on Wednesday. This suggests
that significant additional gains will be made within the coming two
months, although with the market now short-term 'overbought' we won't be
surprised if a 1-2 week top is put in place this week.
Zinc resumes its bull market
Early this year
the per-pound zinc price traded in the US$1.60s -- its highest level in
more than 10 years. It then pulled back and last month it broke below
support at US$1.40 to reach its lowest level since August-2017. This
prompted us to ask (in the 7th May Weekly Update): Is this a normal
correction or the start of a major decline?
Our answer was: "At
this time there's no way of knowing ... but given the continuing bullish
term structure in the LME futures market we think it will turn out to be a
normal correction of similar magnitude to the correction that occurred
during the first half of last year. If so, the short-term downward trend
has almost run its course."
The price has since recovered to the mid-US$1.40s. This is a
preliminary sign that the downward correction has ended.
EV-related speculation boosts nickel
The nickel price has
trended upward since July of last year and during the first half of this
week reached its highest level since late-2014.
The rally in the nickel price has been driven in part by the
substantial decline in the reported LME nickel inventory that began in
November of last year. Refer to the following chart for details. The
decline in this high-profile inventory creates the impression that
physical supply is becoming tight relative to demand.
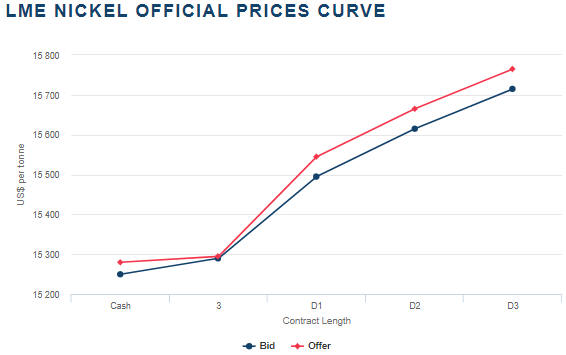
The impression of a growing nickel shortage is most likely false,
because the upward slope of the LME futures curve (see below) indicates
that the market is well supplied. Instead of a tightening supply
situation, what could be happening here is the relocation of physical
nickel from reported to unreported inventory as part of an attempt to
manipulate the price upward. In any case, the declining LME inventory
provides a 'fundamental' justification for bullish speculation.
Another fundamental justification for bullish nickel speculation is
the rise in nickel demand that will stem from the increasing popularity of
electric vehicles (EVs). The cathodes of most lithium-ion EV batteries are
made from nickel, cobalt and either manganese or aluminium, and due to the
potential problems with future cobalt supply there is a major effort by
battery manufacturers to simultaneously reduce the amount of cobalt and
increase the amount of nickel. For example, Tesla's latest shareholder's
letter states:
"Cells used in Model 3 are the highest energy
density cells used in any electric vehicle. We have achieved this by
significantly reducing cobalt content per battery pack while increasing
nickel content and still maintaining superior thermal stability. The
cobalt content of our Nickel-Cobalt-Aluminum cathode chemistry is already
lower than next-generation cathodes that will be made by other cell
producers with a Nickel-Manganese-Cobalt ratio of 8:1:1."
Even
if most EV battery manufacturers can get the cobalt percentage in their
cathodes down to 10% or lower, as Tesla is claiming to have done, it's
likely that the price of cobalt will have to move a lot higher over the
next few years to maintain the supply-demand balance. However, the nickel
mining industry is shaping up to be the main beneficiary of the drive to
reduce the cobalt content of EV batteries.
TSI exposure to
industrial metals
Currently, the TSI Stocks List has
exposure to nickel via Clean TeQ Holdings (CLQ.AX, CLQ.TO) and, to a
lesser extent, Cobalt 27 Capital (KBLT.V). Nevsun Resources (NSU) provides
the only exposure to copper and zinc.
Oil breaks out to
the downside
About two weeks ago (in the 28th
May Weekly Update) we wrote: "...we think that the largest oil-market
correction since mid-2017 has begun. At this time the most plausible
target for a correction low is lateral support near $58."
The
oil price has since broken below its 50-day MA and short-term lateral
support at $66.50.
Intermediate-term lateral support near $58 is still the most plausible
target for a correction low, but the market is now a little 'oversold'.
Our guess is that it will rebound by a few dollars from whatever low is
made this week before resuming its downward trend.
The Stock Market
Current Market Situation
Over the past two weeks it looked as if the NASDAQ100 Index (NDX) was
preparing to test its year-to-date high. The test has just happened.
The NDX actually made a new all-time high on Wednesday 6th June, but
at this time the rise into new-high territory is too marginal to be
classed as a breakout. Furthermore, the NDX is now short-term
'overbought', so there's a good chance that this week's marginal new high
will be followed by a 1-2 week consolidation.
A routine
consolidation would do no more than take the price down to around 6900.
A decline that is more serious than the Q1-2018 correction probably
will begin during the second half of this year. At least, that's what we
expect. Also, it's possible that this larger decline will begin from a
July high, but a downturn that is more than a short-term correction should
be preceded by 'market internals' diverging bearishly from the senior
indices.
There is no sign of such a divergence at this time, so
there is no good reason, yet, to prepare for a large decline in the US
stock market.
Tesla (TSLA) Update
A few
weeks ago we wrote that while it still appeared that bankruptcy was
Tesla's long-term destination, the short-term risk/reward no longer
favoured the bears and it no longer made sense to be short the stock.
The main problem for bearish TSLA speculators was that the short
position had become so large that there was regular support from short
covering and no room for new shorts to get involved in a big way (you
can't sell short if you can't borrow the stock). Moreover, there would be
an uncomfortably (for short sellers) high risk of a strong rebound as long
as support in the mid-$270s continued to hold. The support we are
referring to is defined by the bottom of the channel drawn on the
following daily chart.
Support was successfully tested again about
two weeks ago and the price then began to crawl upward. The crawl turned
into a sprint on Wednesday of this week when the stock price gained 10% in
response to the positive vibe generated by the company's shareholder
meeting.
When the short position is massive it doesn't take much in
the way of good news to precipitate a rapid price rise.
We may be interested in placing a new bet against TSLA (via put
options) within the next few weeks, but now is not the right time.
Gold and the Dollar
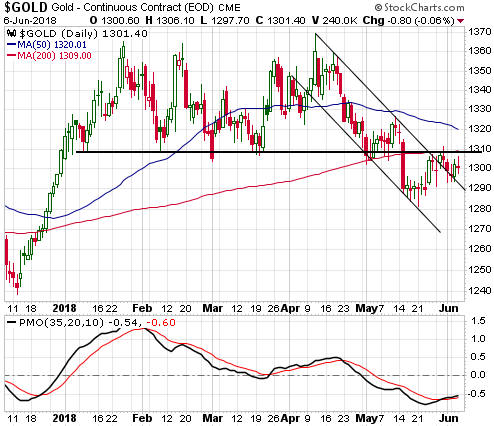
Gold
Since returning to former support (now resistance) at $1309-$1310, the US$
gold price has essentially marked time. However, there are signs that it
is beginning to strengthen. With reference to the following daily chart,
these signs are the upturn in the Price Momentum Oscillator (PMO) shown in
the lower section of the chart and the move above the top of a short-term
downward-sloping channel.
Gold must get above the aforementioned
resistance on a weekly closing basis to signal that a short-term bottom
was put in place last month.
Gold Stocks
The first of the following daily
charts shows that the HUI has been drifting lower within a 40-point
channel since early last year. The second chart shows that over the past 8
weeks the HUI has drifted lower within a 7-point channel. No wonder it
feels like nothing is happening in the gold-mining sector!
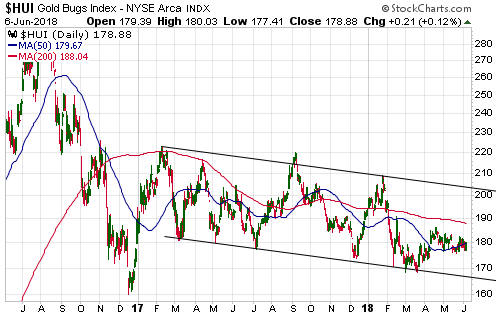
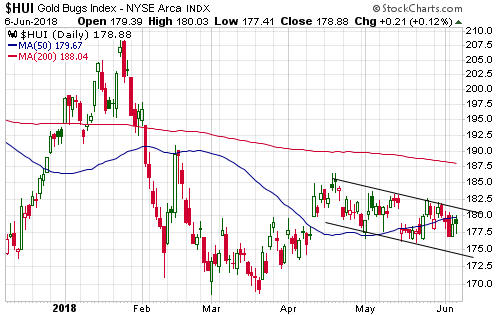
The 8-week downward drift looks like a consolidation within a
short-term upward trend. If this is the correct interpretation then within
the next few weeks the HUI should break out to the upside and quickly move
up to 190-200.
A quick move up to 190-200 by the HUI obviously
would be good for our gold-mining shares for a short time. However, a
rally that gets underway prior to a wash-out decline would have a high
risk of being just another rebound within the 17-months-and-counting
downward drift illustrated by the first of the above charts.
In any
case, we won't have to worry about the possibility that a near-term rally
to 190-200 is just another counter-trend rebound until the rally actually
happens. If it happens then we can review the facts at the time to
determine whether it is more likely to be a short-lived rebound or the
start of a much larger advance.
The Currency Market
The Australian dollar (A$) has broken above its 50-day MA and lateral
resistance at 0.765. This increases the probability that a multi-month
rally is underway. If so, then for the next couple of weeks the 50-day MA
should limit the downside during any 'corrective' activity.
We
expect that the 200-day MA, which is at 0.775 and slowly falling, will act
as a temporary obstacle on the way up.
Updates on Stock Selections
Notes: 1) To review the complete list of current TSI stock selections, logon at
http://www.speculative-investor.com/new/market_logon.asp
and then click on "Stock Selections" in the menu. When at the Stock
Selections page, click on a stock's symbol to bring-up an archive of
our comments on the stock in question. 2) The Small Stock Watch List is
located at http://www.speculative-investor.com/new/smallstockwatch.html
![]() Alkane
Resources (ALK.AX) reported the results of an
updated engineering and financial study on the Dubbo Project (DP), the
most recent previous study having been completed in 2015.
Alkane
Resources (ALK.AX) reported the results of an
updated engineering and financial study on the Dubbo Project (DP), the
most recent previous study having been completed in 2015.
The DP is
fully permitted and slated to produce zirconium, hafnium, niobium and
REEs. At current commodity prices the approximate revenue split would be:
Zirconia products: 46%
REEs: 34%
Niobium: 14%
Hafnium: 6%
The published results of the new study were disappointing, for three main
reasons:
1) The company had previously advised that using a
modularised construction process the pre-production capex could be reduced
and the economics could be improved. Specifically, in a press release in
October-2016 ALK advised that by using a modular construction method, with
much of the construction happening off site, it should be possible to
reduce the total capital cost of the DP from US$930M to US$840M and reduce
the up-front capital cost to US$480M. However, in the Staged Build plus
Modular Construction scenario considered as part of the latest study, the
total capex is estimated to be US$1.1B and up-front capital is estimated
to be US$610M. As a result, the economics of the staged/modular scenario
are worse than the economics of the base case scenario.
2) The
prices for the commodities that will be produced by the DP are on average
significantly higher now than they were when the 2015 study was completed,
leading to a 14% increase in the forecast annual revenue. However, the
profitability boost that should have stemmed from the higher selling
prices has been totally offset by higher operating expenses.
3) As
it did in the 2015 study, ALK only quoted the DP's pre-tax economics.
There was no mention of post-tax economics, but unless the company has
figured out a way to avoid paying tax it's the post-tax numbers that are
important.
Despite higher commodity prices and the financial
benefits that were expected to be achieved via a modular construction
approach, the estimated economics of the DP are almost identical now to
what they were three years ago. The most attractive scenario is the "Base
Case", which is the non-staged approach involving the construction of a
1Mtpa operation at a cost of A$1.3B. At the assumed commodity prices, this
scenario results in a pre-tax NPV(8%) and IRR of A$1.24B and 17.5%,
respectively.
There is nothing wrong with these numbers.
Furthermore, the A$1.24B NPV compares very favourably with ALK's current
enterprise value of around A$70M. The market reacted negatively, though,
because ALK's management had led 'everyone' to believe that the numbers
would be much better.
It would be impossible for a company of ALK's
size to fund the DP's A$1.3B capex without massively diluting the shares
and/or taking on an unwieldy amount of debt. However, it may be possible
to enlist a much larger company as a partner, with the larger company
funding the construction in exchange for a 50%+ stake in the project.
ALK's management is looking into doing exactly that, in that it
describes the top-priority funding solution as:
"Sale of
Project Interest to Strategic Investor: The Company continues to meet with
potential product off-take partners and investment funds with mandates
targeting investment in the key products of the Dubbo Project,
organisations considered to have the best strategic alignment with the
Company."
The other three funding options under consideration,
in priority order, are financing from Export Credit Agencies, traditional
equity and debt financing, and other financing methods such as selling
royalties and streams.
A positive aspect of the updated Study is
the leverage it reveals to changes in commodity prices. For example, if
all else remains the same then a 20% increase in selling prices boosts the
Base Case pre-tax NPV(8%) by almost 80% -- from A$1.3B to A$2.3B. This is
important because the prices of the DP's outputs should continue to trend
upward.
Although the worse-than-expected numbers in the updated DP
Study caused a 10% decline in ALK's stock price as opposed to the bounce
that we were hoping for, it remains clear that the per-share value of
ALK's assets is vastly greater than the current share price. There's huge
valuation-related upside potential, but realising this potential is going
to require more patience than originally expected.
Chart Sources
Charts appearing in today's commentary
are courtesy of:
http://stockcharts.com/index.html
http://www.kitco.com/
http://www.lme.com/
![]()