|
- Interim Update 6th July 2005
Copyright
Reminder
The commentaries that appear at TSI
may not be distributed, in full or in part, without our written permission.
In particular, please note that the posting of extracts from TSI commentaries
at other web sites or providing links to TSI commentaries at other web
sites (for example, at discussion boards) without our written permission
is prohibited.
We reserve the right to immediately
terminate the subscription of any TSI subscriber who distributes the TSI
commentaries without our written permission.
Is a rising oil price inflationary or deflationary?
Interestingly, both the
inflation and the deflation camps routinely portray a high and rising
oil price as being supportive of their respective cases. Those who are
anticipating ever-increasing amounts of inflation, for instance, argue
that the higher cost of energy will ripple through the economy and push
up prices across the board, whereas those who believe that deflation is
imminent argue that the higher cost of energy will restrict the
abilities of consumers and businesses to borrow and spend.
As usual, most participants in the debate talk as if inflation were an
increase in the general price level and deflation were a decrease in
the general price level, thus making the entire debate rather
meaningless. Inflation and deflation are purely monetary phenomena, so
a rising oil price is neither inflationary nor deflationary. It is
simply a rising price. The effect that this price rise has on the
economy will, in turn, be determined by the actions of the central
bank.
For example, in the situation where the central bank is taking steps to
reduce the rate of growth in the money supply then, all else being
equal, higher prices for energy will have to be offset by lower prices
in some other part of the economy. In this situation it is reasonable
to say that the rising oil price could have a deflationary effect
because under such monetary conditions, and with total private-sector
debt already at a very high level, it is probable that less money will
be borrowed into existence in the future. But all else is never equal
and it's distinctly possible that any reduction in private-sector
borrowing stemming from rising energy prices will be offset by an
increase in public-sector borrowing.
Now consider the example of a rising oil price in an environment where
the central bank is working to increase the rate of money-supply
growth. In this case the central bank will effectively be monetising
the increase in the oil price and there will likely be no associated
reduction in borrowing/spending. It wouldn't, however, be reasonable to
say that the rising oil price was inflationary since it would be the
central bank, not the oil market, that was driving the increase in the
money supply and the economy-wide reduction in the purchasing power of
money.
As things currently stand the Fed is acting to REDUCE the rate of
money-supply growth in the US, so the high/rising oil price will
potentially have a deflationary effect. We say "potentially" because,
thanks to the continuing housing-related borrowing frenzy associated
with long-term interest rates languishing near generational lows, it
hasn't YET had a deflationary effect. Of course, if the high cost of
energy did start to have a significant deflationary effect then the Fed
would do an about-face and begin to work towards increasing the
money-supply growth rate; so even in this case the probability of
deflation actually occurring would be extremely low.
Greenspan's last days
...the
Fed isn't likely to do anything different simply as a result of
Greenspan being in his final months as Fed chief. However, we expect
that the transition to someone new will have an adverse effect on
financial market confidence...
Alan Greenspan's term as a Federal Reserve governor ends early next
year, so unless a special arrangement is made to allow him to stay
longer there will be a new Fed Chairman in about 6 months time. This
raises the following questions: First, does Greenspan being in his
final months as Fed chief have any implications for US monetary policy
over the remainder of this year? And second, what will be the effect on
the financial markets of the transition from Greenspan to someone new?
There's a school of thought that Greenspan, concerned about how he will
be remembered, will do whatever he has to do to ensure that the US
economy and stock market appear to be in good shape on the day he hands
over the reins at the Fed. We don't have a lot of time for this view,
though, because history won't judge Greenspan's 18 years as Fed
chairman based on how things look on the day of his retirement. More to
the point, we doubt that Greenspan believes that his legacy will be
determined by how things look on his final day. Therefore, it's not
reasonable to expect the Fed to be any 'easier' over the coming two
quarters than would have been the case if Greenspan were not retiring
early next year. In fact, we think it's more reasonable to argue that
the Fed will be 'tighter' than would otherwise have been the case
because Greenspan will know that he won't be the one responsible for
cleaning up the mess resulting from the collapsing of multiple bubbles.
But it's most reasonable, we think, to expect the Fed to behave in a
way that is consistent with its traditional modus operandi; in
particular, to expect Greenspan and Co. to persist with their
rate-hiking until either a) the Fed Funds rate has reached what they
perceive to be 'neutrality', or b) the stock and/or commodity markets
cave in.
Our view, as you know, is that the stock and commodity markets will
cave in long before the Fed reaches what Greenspan and his cohorts
consider to be a neutral Fed Funds Rate.
Further to the above, the Fed isn't likely to do anything different
simply as a result of Greenspan being in his final months as Fed chief.
However, we expect that the transition to someone new will have an
adverse effect on financial market confidence and that this will cause
the Fed to be more accommodative during 2006-2007 than it might
otherwise have been. The reason is that additional uncertainty is
likely to be generated by having 'the devil you don't know' at the helm
of the Fed, especially if downward trends are already entrenched in the
stock and commodity markets.
The high probability of there being a new Fed Chairman early next year
actually meshes very well with our 1-2 year outlooks for various
markets, particularly our view that a new bull market in the gold
sector will get underway late this year.
Evidence of falling growth
An important component
of our intermediate-term outlook is that there will be a ramping down
of global growth expectations during the second half of this year and
much of next year. This lowering of growth expectations should
initially be evidenced by declining prices for cyclical commodities
such as the industrial metals and later -- most likely beginning in the
final quarter of this year -- by considerable strength in
counter-cyclical investments such as gold and gold shares.
As things stand today global stock markets are refusing to buckle and
are therefore not yet confirming the intermediate-term outlook
summarised above. However, significant support for our bearish outlook
on economic growth is coming from other markets and indicators. For
example, the chart at http://www.investmenttools.com/futures/bdi_baltic_dry_index.htm
shows that the Baltic Dry Index -- an index comprising the ocean-going
freight rates on 11 major shipping routes -- has now fallen by around
60% since last December's peak. This crash in freight rates is no doubt
partially due to an increase in the supply of ships, but it's unlikely
that such a precipitous fall could have occurred unless there had also
been a pronounced reduction in global trade.
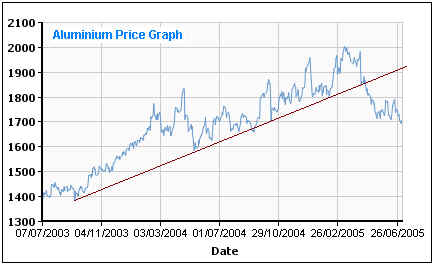
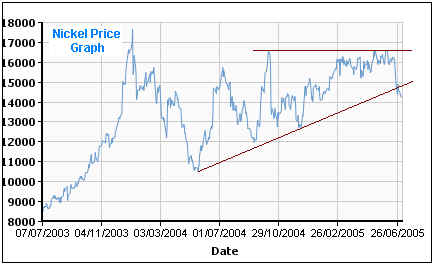
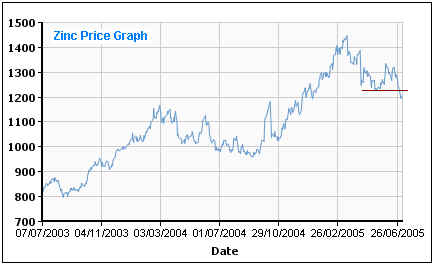
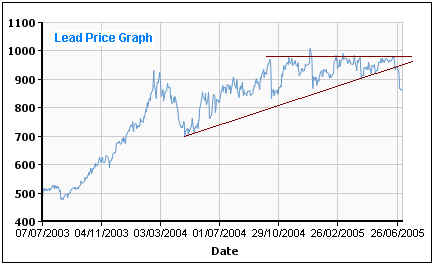
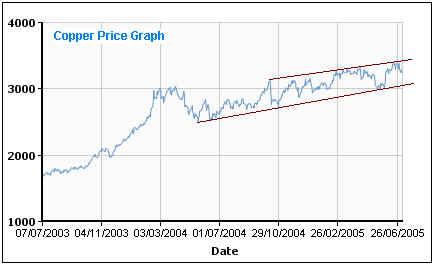
In general, industrial metal prices have also begun to support our
view. The below charts, for example, show that there have been
significant downward moves in the prices of aluminium, nickel, zinc and
lead. Copper is now the lone 'hold out', probably because it is a
speculative favourite of hedge funds. A daily close below
US$3,000/tonne in the 3-month buyer's price for copper on the LME
(London Metal Exchange) would be a clear sign that an intermediate-term
peak was in place in the copper market.
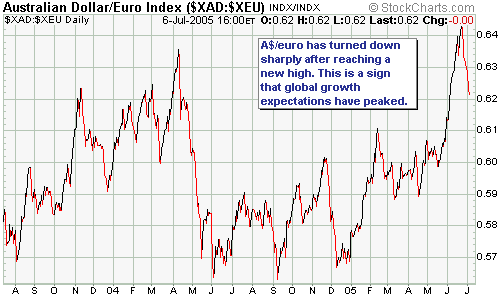
The last piece of
evidence we'll mention is the recent drop in the Australian Dollar
relative to the euro. A$/euro, a chart of which is included below,
tends to move with the US stock market and with global growth (the A$
is widely perceived to be a growth-oriented currency). It is generally
quite volatile so taken in isolation the plunge that has occurred over
the past fortnight is not necessarily significant, but taken alongside
the weakness in metal prices and the on-going decline in the Baltic Dry
Index it constitutes additional evidence that the downturn we've been
anticipating is underway.
The US
Stock Market
Current Market Situation
If
the market continues to decline over the next few weeks then a bullish
divergence will become possible, but only if the Dow drops below 10,000
while the NDX holds comfortably above 1400.
Over the past several years the divergences that have occurred between
the Dow Industrials Index and the NASDAQ100 Index (NDX), whereby a move
to new extreme for the year by the Dow was not confirmed by the NDX,
have turned out to be important. For example, the below chart shows
that there have been two such divergences over the past year -- a
bullish divergence in October-2004 (point A on the chart) when a move
to a new low by the Dow was accompanied by a substantially higher low
by the NDX, and a bearish divergence in March-2005 (point B on the
chart) when a move to a new high by the Dow was accompanied by a
substantially lower high by the NDX.
If the market continues to decline over the next few weeks then a
bullish divergence will become possible, but only if the Dow drops
below 10,000 while the NDX holds comfortably above 1400. The point is,
if such a divergence does occur it will be a good idea to exit, or at
least to reduce exposure to, bearish positions. In fact, if such a
divergence occurs we will seriously consider entering some trades on
the 'long' side. By the same token, there would be no reason to reduce
exposure to bearish positions if a drop below 10,000 by the Dow WAS
confirmed by the NDX dropping below 1400.
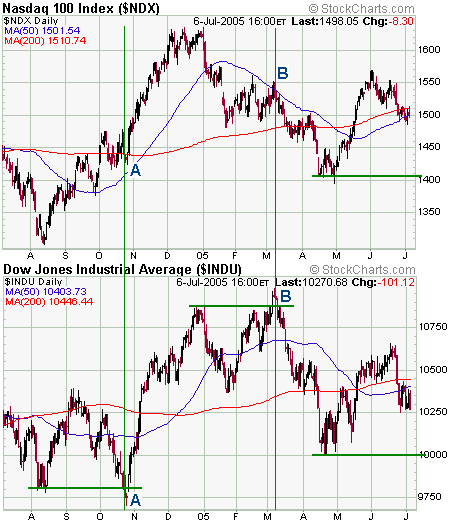
The market is yet to
tip its hand as far as what we can expect over the coming weeks in that
a rebound to test the June highs looks almost as likely as a drop to
test the April lows. A daily close below 10,250 in the Dow would,
however, shift the odds in favour of a drop to test the April lows.
By the way, there was an interesting divergence on Wednesday between
the oil price and the prices of oil-related equities. Specifically,
both the AMEX Oil Index (XOI) and the Oil Service Index (OSX) were weak
in absolute terms and relative to the S&P500 Index even though the
oil price surged $1.70 to a new all-time high. The major oil producers
are no doubt going to announce extremely strong earnings results later
this month, but it's quite likely that these results are already
factored into current stock prices and that the good earnings news will
be taken as an opportunity to sell. We don't want to read too much into
a single day's action, but perhaps yesterday's surprisingly weak
performance by the oil shares was due to some traders anticipating just
that (a sell-off later this month in the wake of good earnings news).
Gold and
the Dollar
Gold Stocks
The below chart shows that the AMEX Gold BUGS Index (HUI) has spent the
past 14 trading days oscillating within a 10-point range. We suspect
that an upside breakout from this range would quickly be followed by a
move up to 210, but not much more than that. And as noted in previous
commentaries, we would consider a close below 192 to be a clear signal
that the rebound was over and that the next downward leg had begun.
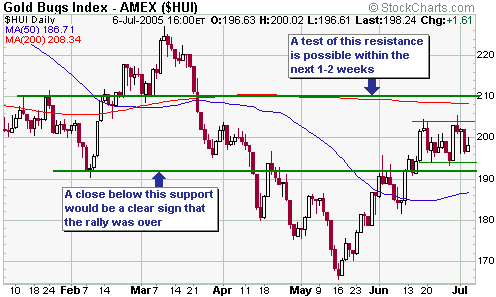
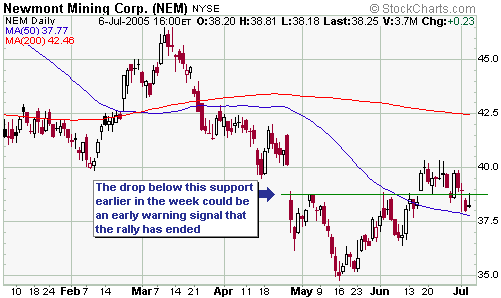
Gold stocks continue
to perform quite well relative to the gold price and we haven't yet
seen any solid evidence that a rebound peak is in place. About the only
short-term bearish sign that we're aware of is this week's drop below
support by Newmont Mining (see chart below). A pullback in NEM to test
June's upside breakout would have been par for the course, but the
stock has dropped a bit further than it ideally should have done. We
wouldn't, however, put a lot of weight on NEM's minor breakdown in the
absence of a close below 192 by the HUI; or a close below 90 by the
XAU; or significant weakness in gold stocks relative to the metal.
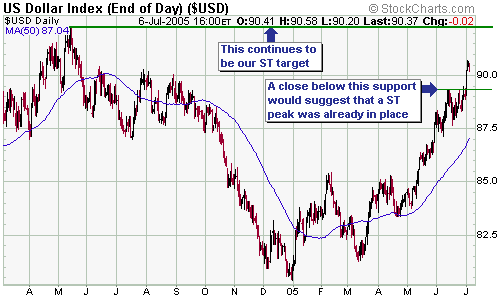
Current Market Situation
Last year's peak of around 92 has been, and continues to be, our target
for the FIRST upward leg in the Dollar Index's rally (see chart below).
We expect that this target will be reached within the next 6 weeks.
Support at just below 89.5 should hold during any near-term pullbacks.
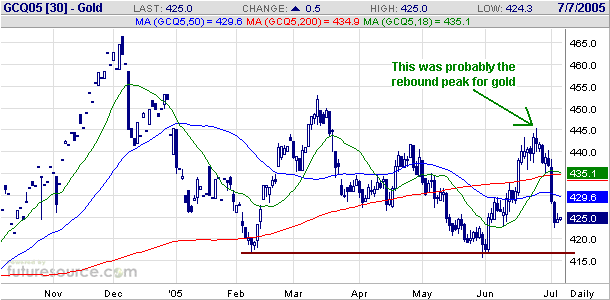
Below is a daily chart of August gold futures.
Despite the fact that gold stocks still appear to have the potential to
move to new rebound highs over the coming days/weeks it looks like a
rebound peak is already in place for gold. If this proves to be the
case it will be a strange turn of events because the gold sector of the
stock market tends to reverse downward, or to at least show relative
weakness, PRIOR to significant peaks in the bullion market.
Critical support for August gold lies at $417, but given that the gold
price has just fallen by $20 in very quick time we'll be surprised if a
break below this support happens within the next 1-2 weeks. However, we
continue to expect that this support will be broken and that gold will
trade below $400 before it embarks on the next major advance in its
long-term bull market.
Update
on Stock Selections
 The
managements of Aflease Gold and Uranium (JSE: AFL, OTC: AFLUY) and
Southern Cross Resources (TSX: SXR) are planning to merge the two
companies to create SXR Uranium One, a company that will be listed on
the Toronto Exchange under the symbol SXR. Although the merger will be
carried out by SXR issuing 0.9 of its shares for every Aflease share --
the equivalent of 9 SXR shares for every Aflease ADR -- it is
effectively a takeover by Aflease of the smaller SXR because Aflease
shareholders will end up owning 83% of the new company. If everything
goes according to plan the merger will be complete by October. The
managements of Aflease Gold and Uranium (JSE: AFL, OTC: AFLUY) and
Southern Cross Resources (TSX: SXR) are planning to merge the two
companies to create SXR Uranium One, a company that will be listed on
the Toronto Exchange under the symbol SXR. Although the merger will be
carried out by SXR issuing 0.9 of its shares for every Aflease share --
the equivalent of 9 SXR shares for every Aflease ADR -- it is
effectively a takeover by Aflease of the smaller SXR because Aflease
shareholders will end up owning 83% of the new company. If everything
goes according to plan the merger will be complete by October.
This merger provides a way for Aflease to obtain a listing on a major
North American market (it currently only trades on the horrid "Pink
Sheets" market in the US) and a way for Aflease to obtain easier access
to equity financing as it works towards bringing its huge South
African-based uranium project into production. As far as we can tell,
though, it's an expensive way to achieve these ends because the assets
that SXR brings to the table don't appear to be worth what Aflease is
paying for them. What SXR brings to the table are the fully permitted
Honeymoon project in South Australia with its 9.3M-pound uranium
resource and potential production of 880K pounds/year, the Goulds Dam
project in South Australia with its 12.3M-pound uranium resource (4.4M
pounds indicated plus 7.9M pounds inferred), and a few early-stage
exploration projects in Australia and Canada.
In a press release issued to announce the companies' plans it was
pointed out that the merger terms were based on current market prices,
but in our opinion current market prices were under-valuing Aflease and
over-valuing SXR.
Further to the above we think that having Aflease listed on the TSX is
a significant positive, but that the deal, as announced, is a better
one for SXR shareholders than for Aflease shareholders.
We still like Aflease as a long-term investment, but as a result of
this planned merger and a soon-to-occur US$20M financing we would not
be buyers at the current price. Instead, we'd prefer to wait for a
pullback to around US$6.00 before doing any new buying.
Chart Sources
Charts appearing in today's commentary
are courtesy of:
http://stockcharts.com/index.html
http://www.futuresource.com/
www.lme.com

|