![]()
![]()
![]()
![]()
- Interim Update 6th July 2016
Copyright
Reminder
The commentaries that appear at TSI
may not be distributed, in full or in part, without our written permission.
In particular, please note that the posting of extracts from TSI commentaries
at other web sites or providing links to TSI commentaries at other web
sites (for example, at discussion boards) without our written permission
is prohibited.
We reserve the right to immediately
terminate the subscription of any TSI subscriber who distributes the TSI
commentaries without our written permission.
Employment Report
Volatility
Despite its uselessness as an
economic indicator, the monthly US Employment Report often causes a marked
increase in financial-market volatility. This is because the Employment
Report has a big influence on the Fed.
This month the stage is set
for the volatility increase to be greater than usual when the latest
employment data are published on Friday. The reason is that the stock,
bond and gold markets are simultaneously stretched to the upside and the
Dollar Index is situated near an important demarcation level.
Given
that the Fed Funds futures market has discounted a near-complete absence
of Fed rate hiking all the way out to early-2018, the markets appear to be
most vulnerable to a stronger-than-expected Employment Report. However,
both a very weak and a very strong report have the potential to
temporarily wreak havoc.
Regardless of the employment data and the
initial reaction to the data, the most important consideration will be the
closing levels of the various markets. Furthermore, the most useful
information will be provided in the case where there is a failure to
sustain an initial reaction. For example, a surge in the T-Bond price in
reaction to a weak employment report followed by a full retracing of the
initial gain and a lower close on the day would be informative, as would a
surge in the Dollar Index in reaction to a strong employment report
followed by a full retracing of the initial gain and a failure to end the
week above the May high (96). The former would be a clear signal of a bond
top and the latter would be short-term bearish for the US$.
T-Bond Update
The US T-Bond has extended its
post-Brexit upside blow-off by making new intra-day and closing highs over
the past three days (see chart below). This has boosted the bullish
enthusiasm of bond speculators, with Market Vane's bullish consensus for
both T-Bonds and T-Notes hitting new multi-year highs. It has also boosted
the downside risk.
We added the TBT (a leveraged T-Bond bear fund)
September-2016 $35 call option to the TSI List almost two weeks ago in an
effort to profit from a downward reversal in the T-Bond. A downward
reversal is obviously yet to happen, but we continue to like the idea of
averaging into a bond-bearish option position. We are therefore going to
add a second TBT September-2016 call option to the TSI List and treat the
two options as a single trade (meaning: the result of the trade will be
the average result of the two positions).
Due to the price action
of the past several days, the $35 option is now a little too far out of
the money to be the preferred vehicle. Instead, we have chosen the
September $33 calls, which ended Wednesday's session at US$0.58.
Note that T-Bonds and gold have ramped upward together and are likely to
reverse course at around the same time, so in addition to being a
reasonable speculation in its own right a bearish T-Bond position could
also be viewed as a way of hedging against short-term downside in the gold
price.
The Stock Market
The US
In the latest Weekly Update we stated that due to greater internal
strength, the US stock market's risk/reward isn't as skewed towards risk
as it was on previous occasions over the past 12 months when the SPX was
near its current price (around 2100).
One method of measuring the
internal strength is via the numbers of individual stocks making new
52-week highs and lows. Another method is by comparing the performance of
the SPX, which is market-cap weighted, and its unweighted equivalent. The
first method was illustrated by a chart included in the Weekly Update. The
second method is illustrated by the chart displayed below.
The
bottom section of the chart shows the UWSPX/SPX ratio (the unweighted SPX
divided by the normal market-cap-weighted SPX). Notice that this ratio
turned down in advance of the major top in 2007 and the intermediate-term
tops in 2011 and 2015. Notice also that when the ratio turned upward in
late-2008 and mid-2012 it signaled that the SPX's downward trend had ended
or was about to end.
The performance of the UWSPX/SPX ratio over
the past few months suggests that the January-2016 low was more important
than we thought at the time.
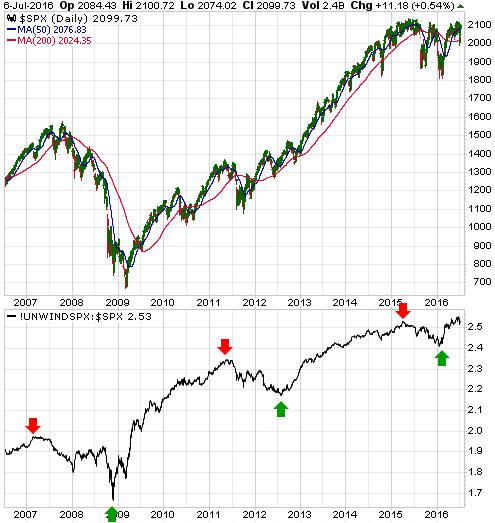
The over-valued US stock market is probably not going to run away to
the upside anytime soon, but it now looks like the low for the year was
put in place during January-February.
Emerging Markets
The popular assumption is that emerging-market equities remain in
long-term downward trends. This assumption hasn't yet been invalidated,
but it wouldn't take much strength from here in the Emerging Markets
Equity ETF (EEM) to do so. All it would take is for EEM to achieve a
weekly close above $35, which is within 4% of the current price. The
reason is that a weekly close above $35 would complete a 12-month basing
pattern.
Of greater interest to us than the performance of EEM in
dollar terms is its performance relative to the US stock market. This
relative performance is indicated on the lower section of the following
chart by the EEM/SPY ratio.
The EEM/SPY ratio needs to make
additional gains to signal the start of a commodity bull market.
Gold and the Dollar
Gold
There wasn't a significant change in gold's situation over the first three
days of this week. The $1308 level is still the support that must hold on
a daily closing basis to sustain the short-term upward trend and on a
weekly closing basis to sustain the intermediate-term upward trend.
The stage is set for considerable volatility on Friday in reaction to
the latest US employment data.
Silver
In
the latest Weekly Update we wrote: "...almost regardless of what
happens to the silver price over the next few weeks there is a decent
chance that it will fall to $15 or lower during the subsequent correction."
This comment was included without further explanation and unsurprisingly
provoked some questions from our readership. Here's the further
explanation.
"$15 or lower" is a little extreme, but based on
silver's historical performance following exponential advances a quick
decline to around $16 would be par for the course if a rally top happened
this month. That being said, the historical record also suggests that the
rapid advance could continue for up to two more months with an intervening
pullback to the 50-day MA, which could raise the floor for the ensuing
sharp decline by a couple of dollars.
The historical record's
overarching message is that once silver completes an advance of the type
that began early this year, the top is almost always followed by a quick
decline to the 200-day MA or a little lower. The 200-day MA is presently
in the $15.50s and is rising in such a way that it will probably be around
$16 a month from now. Hence our comment regarding the short-term downside
risk. As mentioned above, however, history also suggests that the rally
top -- and the start of a sharp decline to the 200-day MA -- might not
happen for another two months (as late as September, that is).
Here are four of the historical parallels in reverse date order (from most
recent to most distant). There will always be significant differences in
the fundamental backdrop, but optimism tends to build and then collapse in
similar fashion every time.
The first is the rally that began in
September of 2005 and reached a crescendo in April-May of 2006. This was a
rally within a bull market. As illustrated below, there were three
pullbacks to near the 50-day MA along the way followed by a spectacular
2-month blow-off to the upside. The upside blow-off was then retraced
within 4 weeks.
The second is the rally that began in October of 2003 and maxed-out in
April of 2004. This was a rally within a bull market. In this case there
was only one pullback to near the 50-day MA along the way. Also, following
the top it took only four weeks to retrace two-thirds of the entire rally.
The third is the rally that began in February of 1993 and maxed-out in
August of that year. This was a bear-market rebound. As happened with the
2003-2004 rally, there was only one pullback to near the 50-day MA along
the way and it took only four weeks to retrace two-thirds of the entire
rally.
The fourth is the rally that began in June of 1982 and ended in
February of 1983. This was a bear-market rebound. As was the case with the
2005-2006 rally, there were three pullbacks to near the 50-day MA along
the way followed by a 2-month blow-off to the upside. The initial decline
that followed the 1983 peak was relatively mild with respect to how much
of the preceding advance was retraced, but the advance from the 1982 low
ended up being retraced in full within the ensuing three years.
This year's performance of silver (see chart below) currently looks
most similar to the bear-market rebound of 1982-1983. The same, by the
way, can be said about the performances of the gold-mining indices. An
implication is that if a pullback over the next few weeks holds near the
50-day MA then there will likely be another impressive price surge to a
September high.
Finally, there are two things that should always be kept in mind when
silver goes for one of its periodic multi-month sprints. The first is that
silver never experiences a spectacular rally and then works off the
'overbought' extreme by trading sideways for several months. Instead, it
always eliminates the 'overbought' extreme by plunging in price. The
second is that it doesn't matter how fast the rally, the decline from the
top is always faster.
Gold Stocks
The HUI
has blown through every resistance level and is stretched to the upside
over every practical time-frame. On a very short-term basis, it has just
risen for 5 days in a row and on 9 of the past 10 days.
Short-term
downside risk in the gold-mining indices is now extreme. At the same time,
the continuing strong rise means that the only historical parallel to this
year's rally is now the bear-market rebound of 1982-1983 (the first rally
from a multi-year low in a new bull market has never gone anywhere near as
far as this year's rally). If this year's rally matches the performance
achieved during the rebound from the 1982 low then the HUI will trade at
300 before the end of August.
For our own accounts we've been
responding to the continuing extraordinary strength in the gold-mining
sector by partially or fully replacing large positions in relatively
liquid/low-risk gold stocks with much smaller positions in relatively
illiquid/high-risk gold stocks. For example, on Wednesday of this week we
exited the final 30% of our Endeavour Mining position (at C$24.30) and
added a much smaller/higher-risk gold stock using 25% of the proceeds of
the EDV sale. This process raises cash and reduces the risk of suffering a
large portfolio draw-down while maintaining significant exposure to
further strength.
We generally can't reflect the above-mentioned
process in the TSI Stocks List because most of the stocks we are now
accumulating are too speculative and can't be added/removed from the List
without substantially affecting their prices, although there is one
highly-speculative stock that we are looking at that could be suitable for
the TSI List. Depending on what happens in reaction to Friday's US
employment news, we might discuss it in the Weekly Update.
What we
can do with the TSI Stocks List is reflect a shift in focus from
gold-mining stocks, which have generally had huge run-ups and no longer
(as a group) offer enough value, to base-metal stocks, which in many cases
have been in correction mode over the past 2 months. Reflecting this shift
in focus began with the email that was sent to subscribers on Tuesday.
The Currency Market
As we head towards
'employment-report Friday', the Dollar Index is wedged between its 200-day
MA and the demarcation level defined by its May high. It needs to achieve
a weekly close above the late-May high (96) to signal that an
intermediate-term bottom was put in place in early-May. By the same token,
a failure to generate a bullish signal at the end of this week would be a
reason to suspect that the early-May low was only the short-term variety.
Updates on Stock Selections
Notes: 1) To review the complete list of current TSI stock selections, logon at
http://www.speculative-investor.com/new/market_logon.asp
and then click on "Stock Selections" in the menu. When at the Stock
Selections page, click on a stock's symbol to bring-up an archive of
our comments on the stock in question. 2) The Small Stock Watch List is
located at http://www.speculative-investor.com/new/smallstockwatch.html
![]() New
stock selection: Taseko Mines (TGB, TKO.TO). Shares: 222M issued, 234M
fully diluted. Recent price: US$0.54
New
stock selection: Taseko Mines (TGB, TKO.TO). Shares: 222M issued, 234M
fully diluted. Recent price: US$0.54
In the email sent to
subscribers on Tuesday we added junior copper producer Taseko Mines (TGB)
and junior zinc explorer Solitario (XPL) to the TSI List. Some more
information about TGB is provided below and some more information about
XPL will be provided in the coming Weekly Market Update.
TGB is the
operator and 75%-owner of the Gibraltar copper mine in British Columbia,
Canada. Gibraltar is expected to produce 130M-140M pounds of copper in
2016, which implies that TGB's 2016 copper production is expected to be
around 100M pounds.
Gibraltar's operating cost is about US$2/pound,
so at the current copper price it is likely to make either a small profit
or a small loss. That is, TGB is a marginal producer in today's market,
meaning that its bottom-line results are leveraged to changes in the
copper price. If the copper price rises to $3/pound then TGB becomes very
profitable and its shares attain a much higher price, but if the copper
price makes a sustained break below $1.90 then TGB becomes very
unprofitable and its share price goes much lower.
Assuming 100M
pounds of production and a copper price of US$2.20/pound, TGB's annual
revenue would be US$220M. At the current share price of US$0.54 its market
cap is US$120M, or only slightly more than half its annual revenue. This
is a very low revenue multiple for a junior metal producer, but the
valuation doesn't look so low after we take into account the company's
debt.
TGB has net debt (long-term debt minus working capital) of
about C$260M (US$203M). When we add the net debt to the market cap we get
an enterprise value (EV) of about US$330M, which means that TGB's EV is
about 1.5-times its annual revenue. This, however, is still a reasonable
valuation considering that in addition to its 75% ownership of Gibraltar,
TGB owns some potentially-valuable exploration/development-stage projects.
The most interesting of the aforementioned
exploration/development-stage projects is the Florence In-Situ Recovery
(ISR) copper project in Arizona. Florence has a low-grade M&I resource
comprising 2.8B pounds of copper and could possibly be brought into
production within a couple of years.
Although TGB's balance sheet
with its US$203M of net debt is not healthy, the company's financial
situation appears to be manageable. Of particular relevance, TGB has C$60M
of working capital including inventories (C$18M excluding inventories) and
undrawn credit of C$48M. Also worth mentioning is that about 80% of its
costs are C$-denominated, which -- because the C$ usually trends in the
same direction as metal prices -- reduces risk while detracting a little
from the leverage.
TGB's chart pattern looks constructive, with a
strong 3-month rally followed by a normal-looking correction to the
200-day MA. It was the chart pattern that prompted us to 'pull the
trigger' early this week.
We like the risk/reward here, because IF the copper price is in the
process of turning higher on an intermediate-term basis then TGB could
potentially triple or more over the coming 12 months.
 Exiting Sabina Gold and Silver (SBB.TO)
In the
20th June Weekly Update we discussed the decision by the Nunavut Impact
Review Board (NIRB) to recommend against SBB's Back River gold project. At
that time SBB was in the low-C$1 area (having just plummeted from C$1.70)
and was likely to find support a little lower at C$0.90-$1.00, which it
did. Since then the gains in the prices of gold and silver have caused
speculators to forget about risk and bid-up almost anything associated
with precious metals. SBB has benefited from this increasingly-cavalier
attitude towards risk and has rebounded to the C$1.40s.
We expect
that SBB will eventually get the required permits for the Back River
project, because it has the support of the local community and because the
objections raised by the NIRB are ridiculous. However, even in the
best-case scenario the NIRB's ill-conceived decision has delayed the
project by 12 months.
Due to the heightened permitting risk and the
project delay we have taken advantage of the recent rebound to remove SBB
from the TSI List. After we have followed a stock for many years, which is
the case with SBB, we will have identified buying and selling
opportunities at numerous prices along the way, but based on Wednesday's
closing price of C$1.41 and our original entry price the result of this
long-term trade was a profit of 41%.
As an aside, although the
stock is well down from this year's high it is still up by 93% since the
beginning of 2016 and about 300% since last year's bottom.
We will
continue to track SBB's quest for an environmental permit and will
hopefully get presented with a good opportunity to return the stock to the
TSI List in the future.
Chart Sources
Charts appearing in today's commentary
are courtesy of:
http://stockcharts.com/index.html
http://www.barchart.com/
![]()