|
- Interim Update 6th September 2006
Copyright
Reminder
The commentaries that appear at TSI
may not be distributed, in full or in part, without our written permission.
In particular, please note that the posting of extracts from TSI commentaries
at other web sites or providing links to TSI commentaries at other web
sites (for example, at discussion boards) without our written permission
is prohibited.
We reserve the right to immediately
terminate the subscription of any TSI subscriber who distributes the TSI
commentaries without our written permission.
A Strange Inverse Relationship
The inverse correlation between actual inflation and fear of inflation
that's been evident over the past several years is not as strange as it
might appear to be at first glance.
During much of the period between August of 2001 and July of 2003 one
of the major concerns in the financial world was that deflation had
become a legitimate threat. In fact, the fear of deflation became so
pronounced during 2002 that Greenspan felt the need to wheel-out Ben
Bernanke to discuss, in very blunt terms, the Fed's ability to devalue
the currency by creating unlimited amounts of the stuff. Furthermore,
the Fed, which has often attempted to paint itself as an
inflation-fighter, began publicly worrying about an unwelcome FALL in
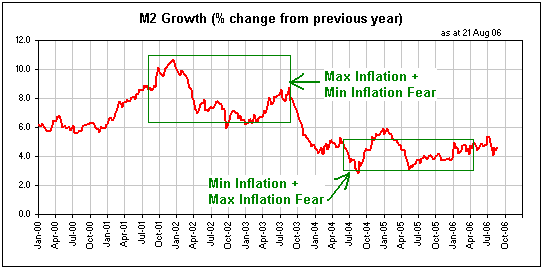
inflation. Interestingly, however, and as reflected by the following
chart of year-over-year M2 growth, the TROUGH in inflation fears
coincided with the PEAK in actual inflation (money supply growth).
Around the middle of 2003 the fear of deflation quickly began to
evaporate and prices began to rise. In fact, there was such a
turnaround in sentiment that by the second quarter of 2004 inflation
was once again viewed to be 'public enemy number one'. Sentiment had
done a 180-degree turn due to surges in the prices of commodities,
equities and houses, as well as signs that the labour market was
becoming quite strong. However, with reference again to the following
M2 chart notice that the re-emergence of the inflation bogey in the
minds of market participants occurred after actual inflation had fallen
to a relatively low level.
The inverse
correlation between actual inflation and fear of inflation that's been
evident over the past several years is not as strange as it might
appear to be at first glance. It arises due to four main reasons:
First, because there is usually a substantial time delay between the
cause (growth in the money supply, a.k.a. inflation) and the effect (an
increase in prices). Second, because the effects of inflation are
almost always non-uniform (different prices are affected in different
ways at different times). Third, because most people have been
conditioned to view rising prices as the problem rather than as an
effect of the problem. And fourth, because the Fed and all other modern
central banks react to what's happening with prices (they frame their
monetary policies in response to the lagged effects of the inflation
rather than to the inflation itself)*.
So, what we end up getting is the following cycle:
1. In response to weak economic growth or some other perceived crisis,
the central bank takes actions designed to cause inflation (designed,
that is, to stimulate growth in the money supply). At this point
inflation fears are low, but there is little fear of deflation.
2. The supply of money begins to grow rapidly in response to the
central bank's inflationary policies, but as a result of falling
economic growth and plunging asset prices the main fear is that the
bank's efforts to elevate prices will come to no avail. The word
"deflation" starts making regular appearances in the financial news
media. Reporters working for the mainstream financial press seek-out
the views of perennial deflation forecasters who are ready with their
explanations for why the current surge in the money supply will
inevitably be overwhelmed by the deflationary tide. Catchphrases such
as "pushing on a string" are widely used to describe the futility of
the Fed's inflationary efforts.
3. A large increase in the supply of money will ALWAYS lead to higher
prices somewhere in the economy, so after a (sometimes substantial)
time delay prices begin to rise in response to the central bank's
actions. However, by this stage in the process the actual inflation
rate (the money-supply growth rate) is well past its peak.
4. As time goes by the effects of the preceding inflation continue to
bubble-up to the surface and eventually become apparent in the popular
price indices. The debt market begins to discount more currency
weakness (the market pushes bond yields upward) and central bankers,
worried that inflation fears could soon get out of hand, decide to
tighten monetary policy. By this stage in the process, however, market
forces have caused the actual rate of inflation to fall to a much lower
level, paving the way for a future REDUCTION in the rate of currency
depreciation.
5. After a period of monetary tightening the central bank and the
markets begin to fear that the risk posed by a weakening economy has
become greater than the risk posed by currency depreciation (one of the
main effects of inflation). That is, the fear of inflation has subsided
and the fear of slower growth has gained the ascendancy. The central
bank's tightening campaign thus comes to an end, but by this time a
severe economic downturn is 'baked in the cake'.
6. In response to weakening economic growth and/or a crisis brought
about by the unwinding of the preceding central-bank-created
inflationary boom, the central bank begins implementing policies
specifically designed to cause more inflation.
In a world where counter-cyclical monetary policy dominates and where "Keynesian economists"
are well respected, more inflation will always be the prescribed remedy
for the problems caused by inflation. This is partly because so few
people recognise the underlying cause of the problem and partly because
many of the ones who do perceive the true cause think that it's better
to implement a 'bandaid solution' that allows the game to continue for
a while than to implement a long-term fix.
At the current time the financial world appears to have just entered
Stage 5 in the above cycle, although things are precariously balanced.
In particular, if the gold price were to break above its May high over
the next 2 months -- not something we expect but certainly not
something we can rule out -- then the markets and the Fed would likely
shift back to Stage 4 (the Fed would resume its rate-hiking to prevent
inflation fears from getting out of hand).
*Central bankers
don't operate in this way out of stupidity. They are well aware of the
consequences of inflation, but their charter is not to stop the
inflation in its tracks. Rather, their charter is to keep the inflation
going whilst managing inflation expectations; and inflation
expectations generally only rise to worrisome levels after the prices
of commodities, goods and services have moved considerably higher in
response to the inflation facilitated by the central bank.
The Stock Market
Current Market Situation
From the latest Weekly Market Update:
"Taking into account both
the supportive sentiment situation...and the bearish signal just
generated by the OEX put/call ratio, the short-term scenario that makes
the most sense to us involves a 1-3 week pullback during September
followed by a rally that takes the S&P500 Index to new highs for
the year."
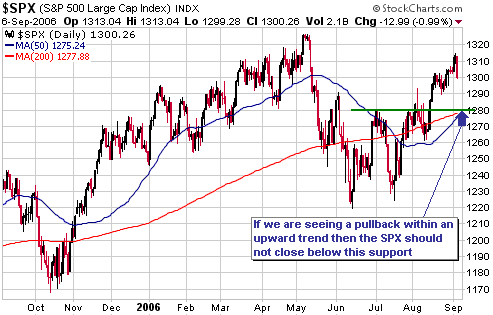
Wednesday's price action suggests that the anticipated September
pullback has begun. If it is a pullback within an on-going upward trend
then the S&P500 Index should remain above support at 1280.
Gold and
the Dollar
Gold Stocks
Regardless
of whether or not the gold sector closely follows our current roadmap
(a September high followed by a November low), we think it makes sense
to anticipate more corrective action prior to the start of the next
intermediate-term rally.
The relative performances of the main gold stock indices (the HUI and
the XAU) have been distorted over the past week by the Goldcorp-Glamis
merger deal. The distortion has primarily occurred because the
acquiring company (Goldcorp) has a larger weighting in the XAU and its
stock price has plunged, whereas the company being acquired (Glamis)
has a larger weighting in the HUI and its stock price has surged. In
addition, the HUI contains a number of smaller stocks that have
benefited from the general increase in takeover-related speculation
catalysed by the Goldcorp/Glamis merger.
As a result of the merger deal the HUI's break above resistance at 350
has not yet been confirmed by an equivalent breakout in the XAU.
Unfortunately, the non-confirmations don't end with the XAU. In
particular, the performances of Royal Gold (NASDAQ: RGLD) and Newmont
Mining (NYSE: NEM), charts of which are included below, add some mud to
the technical waters.
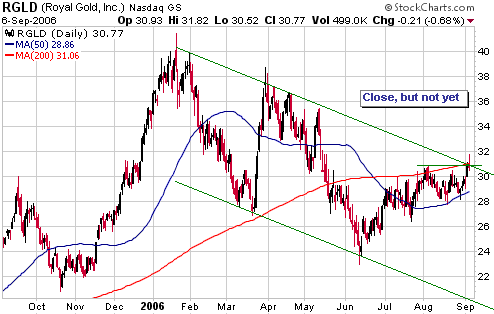
RGLD has a tendency to lead at important turning points in the gold
sector, but the recent rally has not yet caused the stock to break
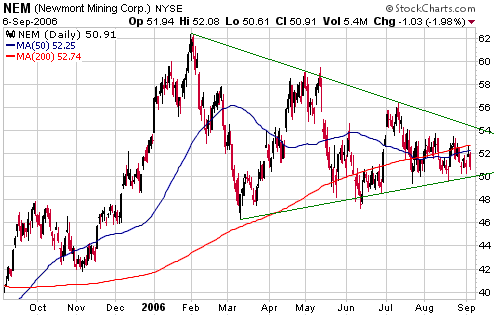
above resistance at $31. And NEM, the world's largest unhedged gold
mining company, has dropped back to near the bottom of a 7-month
consolidation pattern and is in danger of breaking-out to the DOWNSIDE.
We expect that a) the
XAU will confirm the HUI's breakout by moving decisively above 150, b)
RGLD will break above resistance at $31, and c) NEM will soon reverse
upward and break above the downward-sloping trend-line that dates back
to its January peak. If we do get such obvious confirmations of
strength over the next couple of weeks then most people involved in the
gold sector will undoubtedly become very bullish and begin anticipating
a major multi-month advance, thus creating the right sentiment backdrop
for a sharp decline to an October-November bottom.
There are obviously alternatives to the scenario outlined above, but
based on the way intermediate-term corrections have unfolded in the
past it's very unlikely that the gold sector's most recent correction
ended in June. Those who are saying that a major advance to well above
the May-2006 peak has already begun are, in effect, saying that the
LONGEST intermediate-term rally in the gold sector's bull market has
been followed by the SHORTEST intermediate-term correction (if the
correction ended in June then it only lasted 5 weeks, whereas the
shortest intermediate-term correction over the preceding 5 years lasted
6 months). Regardless of whether or not the gold sector closely follows
our current roadmap (a September high followed by a November low), we
think it makes sense to anticipate more corrective action prior to the
start of the next intermediate-term rally.
Just to reiterate our general outlook, we think the gold stock indices
made their price lows in June and that the next large decline will do
no worse than 'test' the June lows. Rather than additional price
weakness beyond what was achieved during May-June, what is needed to
complete the correction is more TIME.
Further to the above, we think it would be a good idea for those who
have substantial exposure to gold stocks to do some selling into
strength over the next 3 weeks. As noted in the past, our approach is
to maintain a sizeable core position in high-potential gold stocks at
all times. We then add to this core position during 'the purges' and
scale back to the core position during 'the surges'. If this approach
is implemented properly then the dollar value of the core position will
increase substantially over any 2-year period as long as the secular
bull market remains intact.
Gold
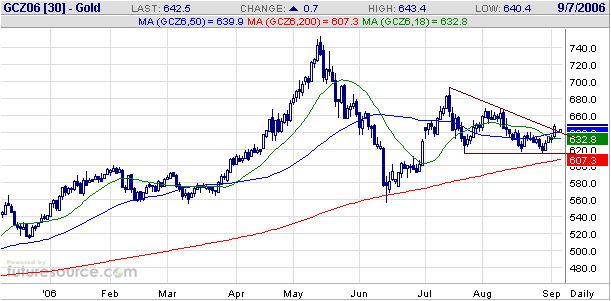
Gold hasn't yet broken upward from its triangular consolidation pattern
(see chart below), but the recent firmness in the major gold stocks
suggests that it will soon do so. The short-term upside objective we
have in mind for gold is the range between its July high and its May
high ($690-$740 in the December futures contract).
The Dollar
Below is a daily chart of September euro futures.
The euro has spent the past 4 months oscillating within a 5-point range
and the last month oscillating within a 2-point range. Furthermore, the
euro's already-narrow trading range is contracting, so a breakout, in
one direction or the other, should soon occur.
With gold and gold stocks looking like they going to head higher over
the coming 1-3 weeks we would normally assume that the odds were in
favour of the euro breaking-out to the upside (the US$ breaking-out to
the downside) from its recent narrow trading range. However, given that
last September featured strong concurrent rallies in gold, gold stocks
and the US$, we aren't inclined to jump to any conclusions regarding
the direction of the next multi-point move in the currency market. We
will, instead, wait for the euro to close above 1.2950 or below 1.2750
before jumping to any conclusions.
Update
on Stock Selections
(Note: To review the complete list of current TSI stock selections, logon at http://www.speculative-investor.com/new/market_logon.asp
and then click on "Stock Selections" in the menu. When at the Stock
Selections page, click on a stock's symbol to bring-up an archive of our comments on the stock in question)
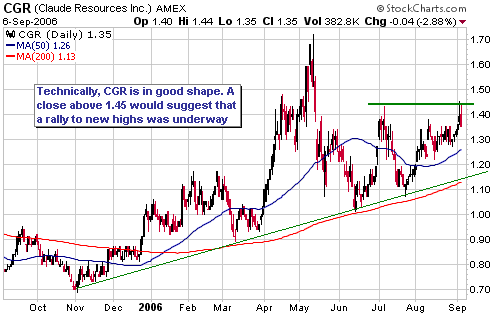
 Claude Resources (AMEX: CGR, TSX: CRJ). Shares: 73M issued, 79M fully diluted. Recent price: US$1.35 Claude Resources (AMEX: CGR, TSX: CRJ). Shares: 73M issued, 79M fully diluted. Recent price: US$1.35
We added CGR to the TSI Stocks List in August for two main reasons.
First, the company's market capitalisation was more than fully
justified by the 50K oz/yr of gold currently being produced by its
100%-owned Seabee Mine in Canada. Second, substantial upside potential
was provided by the Madsen project in Canada's Red Lake mining district
(refer to http://www.clauderesources.com/html/madsen.html for a
description of this project).
Early this week there was a significant development with regard to the
Madsen Project. But first, some background info from the 9th August
Interim Update:
"CGR and GG [Goldcorp]
have a joint venture arrangement whereby the major gold producer (GG)
can earn a 55% stake in the Madsen project by completing a bankable
feasibility study (BFS) by the end of 2006. In addition, after
completion of the feasibility study CGR can elect to have its interest
reduced from 45% to 40% by requiring that GG cover its portion of the
mine construction costs. In other words, if everything goes according
to plan then CGR will end up with a 40% stake in a profitable
high-grade gold mine operated by Goldcorp without spending another
dollar on the project.
It gets even more
interesting, though, because there is no chance that GG will be able to
complete the BFS within the allotted time. This means that to avoid
losing its 55% stake in the Madsen project GG will have to either buy
CGR or re-negotiate the terms of the earn-in arrangement between now
and year-end. Whatever way this is resolved it's hard to imagine that
CGR's shareholders won't benefit."
In other words, due to the impossibility of GG being able to meet the
requirements to earn its 55% stake in the Madsen project it was certain
that some sort of new arrangement would have to be negotiated.
As it turned out, CGR and GG were unable to come to terms and GG has
forfeited its earn-in rights. Therefore, CGR now owns 100% of the
Madsen project.
We view this week's news as a short-term negative and a longer-term
positive. It's a short-term negative because the probability of CGR
being taken over within the next few months is now a lot lower and
because CGR will now have to finance 100% of the Madsen development.
It's a longer-term positive because CGR now has ALL the upside
potential associated with Madsen.
 The Canadian energy trusts that have high natural gas (NG) weightings
are, as you would expect, plays on the natural gas price. In addition,
they are influenced by bond yields. This is mainly because a lot of the
investment demand for the energy trusts comes from people looking for
dividend income (the lower the risk-free bond yield the more attractive
the energy-trust distributions will appear to be). Lastly, the trusts
aren't usually influenced in a big way by the performance of the broad
stock market. For example, when the broad stock market tanked during
2002 the natural gas trusts generally did OK.
Unlike the NG-focused energy trusts, the stocks of major gas-producing
companies such as Chesapeake Energy (NYSE: CHK) and Encana (NYSE: ECA)
tend to be influenced as much by the trend in the broad stock market as
they are by the trend in the NG price. For this reason they've held up
remarkably well in the face of the collapse in the NG price over the
past 9 months and would likely be hit hard if the broad stock market
were to tank in the future.
The main difference between the above-mentioned two sets of stocks is
that the trusts payout the bulk of their earnings to shareholders, with
the payouts increasing/decreasing in response to major changes in the
NG price, whereas the likes of CHK and ECA are growth-oriented
companies that re-invest the bulk of their earnings.
In the TSI Stocks List we have a short-term position in CHK and a
(potentially) longer-term position in a bunch of NG-focused energy
trusts. It's the CHK position that we want to re-visit today.
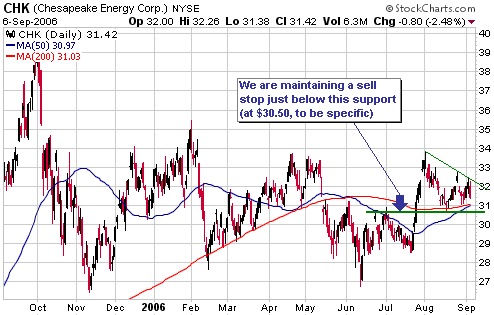
As clearly evident on the following chart, CHK has spent much of the
past year oscillating back-and-forth within a $7 range. In mid-July we
suggested buying either the stock or the January-2007 $30 call options
on the expectation that the next rally would carry CHK out of this
range and up to around $40. Soon after making this suggestion the stock
surged from $29 to $34 and then, quite predictably, began to
consolidate its gains.
If our short-term bullish view on CHK is correct then the price should
hold above support at around $30.50 during the current pullback and
then surge anew. By the same token, a close below the aforementioned
support would invalidate our short-term bullish view and prompt us to
exit.
 Brokers Brokers
Many of the resource stocks with the greatest upside potential trade on
the Canadian stock exchanges. Therefore and as discussed in previous
commentaries, we think it is vital for investors/traders to have
brokerage accounts that provide DIRECT access to the Canadian
exchanges. At least, it's vital for those investors/traders who want to
maximise their returns.
In the past we've highlighted Stockcross Barry Murphy (SBM), an
off-line broker based in Boston that provides a low-cost service to
non-Canadian investors who want to trade on the Canadian exchanges.
This company continues to be a reasonable option, although it has
recently changed its policy such that orders to buy/sell Canadian
stocks must be placed in US dollars (the orders will still be executed
in Canada in Canadian dollars, but the person placing an order will now
have to determine the US$-equivalent of the C$ price at which they want
the order to be submitted). This, in our opinion, is a problem because
it a) adds a level of inconvenience, b) makes it difficult for
investors to control the C$ price of the order, and c) makes it
impossible for an investor to determine the FX commission being charged
on each executed order.
On the other hand, at www.interactivebrokers.com (a major US-based
on-line broker) you can place orders in Canadian dollars, the brokerage
cost is low, and the FX commissions are both clearly evident and low.
The downside is that it's not possible to trade most Canadian stock
warrants via Interactive Brokers (IB). (Note: the warrants can be
traded via SBM). This is a significant disadvantage because the
warrants on junior gold/resource stocks are where some of the best
profit potential can be found.
Lastly, it is worth mentioning that larger investors interested in
participating in the private placements routinely done by junior
Canadian-based resource companies will not get the opportunity to do so
via either an on-line discount broker such as IB or a US-based off-line
discount broker such as SBM. To have the opportunity to participate in
brokered private placements an investor will, instead, need to have an
account with one of the full-service Canadian brokers that gets
involved in such deals (Canaccord Capital, for example). The
full-service brokers also provide research on individual companies that
can, very occasionally, be useful.
The bottom line is that you will probably need to operate more than one
brokerage account in order to take full advantage of the
gold/commodities bull market.
 In the coming Weekly Market Update we plan to do a very brief (1-2
sentence) update on EVERY position (stock, warrant and option) in the
TSI Stocks List.
Chart Sources
Charts appearing in today's commentary
are courtesy of:
http://stockcharts.com/index.html
http://www.futuresource.com/

|

