![]()
![]()
![]()
![]()
- Interim Update 6th September 2017
Copyright
Reminder
The commentaries that appear at TSI
may not be distributed, in full or in part, without our written permission.
In particular, please note that the posting of extracts from TSI commentaries
at other web sites or providing links to TSI commentaries at other web
sites (for example, at discussion boards) without our written permission
is prohibited.
We reserve the right to immediately
terminate the subscription of any TSI subscriber who distributes the TSI
commentaries without our written permission.
New Models
In an effort to take our
opinions/biases out of the equation, over the past few months we have
introduced models that indicate whether the fundamental backdrop is
bullish, bearish or somewhere in between (neutral) for the US$ gold price
and the US stock market. Each of these models is based on a combination of
what we consider to be the true fundamental drivers of the market in
question, hence the names Gold True Fundamentals Model (GTFM) and Equity
True Fundamentals Model (ETFM). We have been following these fundamental
drivers forever, but prior to the past few months we didn't have a
mechanical method of quantifying their collective message. We like the
model approach and acknowledge that we should have done it a long time
ago, but better late than never. Today we are expanding the approach by
introducing similar models for the Dollar Index and commodities.
Although it is a basket of six currencies, the Dollar Index (DX) is
dominated by the US$/euro exchange rate to the extent that for all intents
and purposes it is the reciprocal of the euro. That explains why the
strength in US equities relative to European equities has been by far the
most important influence on the DX for at least two decades and why the
SPY/EZU ratio (the S&P500 ETF divided by the iShares Eurozone ETF) is half
of our US$ True Fundamentals Model (UTFM). The other half of the UTFM is
the yield spread between the 10-year government bonds of the US and
Germany. The 10-year yield spread deserves inclusion in the Model because
even though the relative equity performance has been a stronger influence
over the long-term, there are periods, such as the past 1-2 years, when
changes in interest-rate differentials exert the greatest pressure.
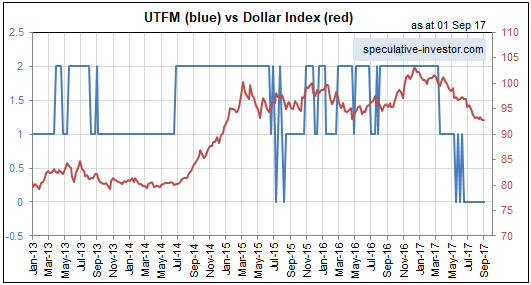
For the UTFM calculation, relative equity performance is assigned a
value of either 1 (bullish) or 0 (bearish) depending on whether the
SPY/EZU ratio is above or below a certain weekly MA. Similarly, the
interest-rate differential is assigned a value of 1 or 0 depending on
whether the US-Germany 10-year yield spread is above or below a certain
weekly MA. The two numbers are then added to give a result of 2 (DX
bullish), 1 (DX neutral) or 0 (DX bearish).
Below is a chart
comparing the UTFM and the DX since the beginning of 2013. Note that the
UTFM did a good job of indicating the strong DX rally that began in
July-2014 and the DX rally that began in May-2016 but was slow to indicate
the downward trend that began in December-2016. With regard to the
post-December-2016 downward trend, the UTFM didn't shift from bullish to
neutral until mid-March and didn't shift to bearish until mid-May. Its
performance over the past 9 months has therefore not been ideal, but if we
are dealing with a long-term trend change then missing the first few
months of the new trend ultimately won't matter.
We reiterate that the UTFM applies to the DX and, by extension, to the
euro. It doesn't apply to the other major currencies. For example, it's
typical for the Australian and Canadian dollars to trend in the same
direction as commodity prices, which implies that the A$ and the C$ have
true fundamental drivers in common with the broad-based commodity indices.
For another example, it's typical for the Yen to trend in the same
direction as the US$ gold price. This happens because a general increase
in risk aversion (bullish for gold) prompts the exiting of Yen carry
trades (putting upward pressure on the Yen), while a general decrease in
risk aversion (bearish for gold) is often associated with a rise in
popularity of the Yen carry trade (putting downward pressure on the Yen).
Moving on, our commodities model is by far the simplest of our models,
the reason being that it is determined by a single factor: the EEM/SPY
ratio (the Emerging Markets Equity ETF divided by the S&P500 ETF). We
could make the model more complicated, but doing so would be
counter-productive because diluting the influence of the EEM/SPY ratio
reduces the usefulness of the message.
The EEM/SPY ratio is a
fundamentals-based commodity-price indicator because it is driven by the
same monetary factors that drive broad-based commodity indices such as the
GSCI Spot Commodity Index (GNX). In particular, during periods of 6-12
months or longer of US$ weakness, the huge US$-denominated corporate debt
load that exists across emerging-market economies becomes less onerous.
This tends to increase the demand for emerging-market equities. Also, when
the US$ is in an intermediate-term or long-term weakening trend the focus
of emerging-market monetary authorities shifts from propping-up their
currencies to address an inflation problem to weakening their currencies
to gain a trade advantage. The currencies are weakened via monetary
inflation (purchasing US dollars with newly-created local currency), which
adds to "global liquidity". The combination of US$ weakness and rising
global liquidity puts upward pressure on US$-denominated commodity prices.
Naturally, the opposite process occurs during periods of 6-12 months or
longer of US$ strength.
Here is a weekly chart showing the EEM/SPY
ratio in the top section and GNX (a general commodity-price proxy) in the
bottom section. The blue lines in the top section comprise a 2.5%
moving-average envelope around the 70-week MA.
Our Commodities True
Fundamentals Model (CTFM) is determined by the position of the EEM/SPY
ratio relative to the aforementioned MA envelope. Specifically, the CTFM
is bullish, neutral or bearish depending on whether the EEM/SPY ratio is
above, inside or below the MA envelope.
Note that the CTFM was
either bullish or neutral (mainly bullish) during the entire period from
late-2001 to mid-2008 and, with the exception of a brief period during the
second half of last year, was either bearish or neutral (mainly bearish)
during the entire period from late-2010 until March of this year.
Due to the influence of sentiment it is not uncommon for markets
to diverge from their 'true' fundamental drivers for up to a few months at
a time, so the sentiment situation must always be taken into account. For
example, it is possible for a bullish sentiment backdrop to override a
bearish fundamental backdrop for up to a few months. In fact, something
along these lines could happen with the DX over the coming 2 months.
However, eventually the fundamentals win through.
Replacing the "Outlook
Summary" table
We have struggled and failed to
make a useful tool from the Outlook Summary table that has appeared near
the top of every Weekly Market Update. The main reason it hasn't worked is
that it is an attempt to impose a digital result on an analog process. The
problem is that there is rarely a single point in time when our outlook
for a market flips from one specific view (bullish, bearish or neutral) to
another. Rather, it tends to be a gradual process.
We can discuss
our opinions about future market direction and risk-versus-reward in the
commentaries, but for the table to be useful it must be completely
objective and evidence-based. To this end, we are replacing the current
table with a much simpler, but hopefully more useful, table that will
contain the latest outputs of the GTFM, ETFM, UTFM and CTFM. It won't be
called the "Outlook Summary" table anymore; it will be called the "True
Fundamentals Summary (TFS)" table.
Based on the situation at the
end of last week, here's how the TFS table looks:
| Market | True Fundamentals Model (TFM) |
| US$ Gold | Bullish |
| US Stock Market (SPX) | Neutral |
| Dollar Index | Bearish |
| Commodities (GNX) | Bullish |
The Stock Market
The S&P500 Index (SPX) remains
below its early-August peak and therefore hasn't yet invalidated our
short-term bearish outlook. At the same time, it hasn't yet validated our
short-term bearish outlook. Doing so would require the breaching of
support at 2400-2410.
We suspect that if the SPX were to close
below 2400 there would suddenly be a lot less complacency and a lot more
fear in the market. Furthermore, if the SPX were to close below 2400
there's a decent chance that computerised trading systems would shift from
automatically buying the dips to automatically selling the bounces. A
rapid 10%-20% SPX decline could be the result.
Obviously, that's a
big "if".
On the news-front there is Kim Jong-un's mischief-making. However,
over the coming two weeks the mischief-making of the ECB and the Fed could
have a greater effect on the financial markets. First, the outcome of the
ECB meeting to be held later today (7th September) will impact the
financial markets due to the uncertainty as to whether or not a tapering
of the ECB's bond-buying program will be announced. Second, the outcome of
the Fed meeting on 20th September will impact the financial markets due to
the uncertainty as to whether or not the start of "quantitative
tightening" will be announced.
Gold and the Dollar
Gold
With the fundamental backdrop being unequivocally bullish for gold (as
indicated by the GTFM) it is reasonable to expect that a $1400 price will
be achieved by/during October. With gold's daily RSI(14) in the low-70s it
is also reasonable to expect that there will be a 1-2 week correction
between now and the move to $1400+, although it is always possible for an
'overbought' or 'oversold' market to become more so before the inevitable
reaction occurs.
The only well-defined objective resistance between
gold's current price in the $1340s and $1400 is last year's peak of $1377.
If there is a quick rise to near this resistance within the next few days
it should be viewed as an invitation to do some selling.
Gold Stocks
The HUI has intermediate-term
resistance at 220 or thereabouts. The stage is set for this resistance to
be breached, either within the next few trading days or following a 1-2
week correction.
The short-term upside potential would be greater
if a breach of resistance at 220 were to follow a 1-2 week
correction/consolidation than if it were to happen within the next three
days. This is because by some short-term measures the HUI is already
stretched to the upside.
Over the past three weeks the gold-mining sector has shown a modicum
of strength relative to gold bullion, which is a positive development.
However, when a slightly longer-term view is taken it becomes clear that
the gold-mining sector has been very weak on a relative basis. In
particular, we point out that when the HUI was near its current level in
February, the gold price was around $1240. This means that the last
$100/oz gain in the gold price resulted in no general improvement in
gold-mining stock prices, which is remarkable.
The following chart
shows the recent bounce in the HUI/gold ratio and also shows that the
HUI/gold ratio is a long way below its February high. The green line on
this chart (the 150-day MA) is now an important demarcation level. The
rallies that began in December-2016 and March-2017 ended soon after this
level was exceeded, so if we are dealing with something more than a
short-term bounce then the HUI/gold ratio should hold above this line
during corrections.
The Currency Market
Last Tuesday (29th August)
there was a potentially important upward reversal in the Dollar Index
(DX). We still have to use the word "potentially" because although the
29th August low has since survived a couple of tests there has been no
follow-through to the upside.
To confirm last week's reversal the
DX will have to close above 94. Until it does there will be a high risk of
a near-term decline to a new low for the year.
So far this week the Canadian dollar (C$) is the major currency with
the most significant and interesting performance.
In late-July the
C$ was at the sort of 'overbought' extreme that could have led to a
sizable correction, but instead of a sizable correction the 'overbought'
condition was eliminated via a sideways consolidation. Thanks to the 6th
September market action it is clear that the consolidation ended late last
week.
With reference to the following daily chart we point out that
the next resistance of significance is the 2015 high near 84. This
resistance should be reached before year-end and could be reached as soon
as this month.
As is the case with gold and its resistance at
$1377, if there is a quick rise by the C$ to near resistance at 84 within
the next few days it should be viewed as an invitation to do some selling.
Updates on Stock Selections
Notes: 1) To review the complete list of current TSI stock selections, logon at
http://www.speculative-investor.com/new/market_logon.asp
and then click on "Stock Selections" in the menu. When at the Stock
Selections page, click on a stock's symbol to bring-up an archive of
our comments on the stock in question. 2) The Small Stock Watch List is
located at http://www.speculative-investor.com/new/smallstockwatch.html
Chart Sources
Charts appearing in today's commentary
are courtesy of:
http://stockcharts.com/index.html
![]()