|
- Interim Update 6th October 2010
Copyright
Reminder
The commentaries that appear at TSI
may not be distributed, in full or in part, without our written permission.
In particular, please note that the posting of extracts from TSI commentaries
at other web sites or providing links to TSI commentaries at other web
sites (for example, at discussion boards) without our written permission
is prohibited.
We reserve the right to immediately
terminate the subscription of any TSI subscriber who distributes the TSI
commentaries without our written permission.
Everyone who's bullish looks right
Almost
regardless of what you are bullish on, as long as you are bullish on
something there's a good chance that you currently look right. The
reason is that the price of almost everything (developed-market
equities, emerging-market equities, gold, industrial commodities,
agricultural commodities, Treasury Bonds, investment-grade corporate
bonds, junk bonds, emerging-market bonds) has been rising. Everything,
it seems, is currently being elevated in response to the belief that
the Fed is preparing to depreciate the dollar by dramatically expanding
its supply. Moreover, while at this stage the most blatant price rises
are those that are expressed in terms of US dollars, prices are rising
in terms of money in general. Today's reality is that many countries
attempt to gain a trade advantage or avoid a trade disadvantage by
limiting the extent to which their currencies appreciate against the
US$. The Fed's inflation-promoting antics thus spread like a wildfire
through the global economy, causing money to 'go up in smoke' and
bringing about a general rise in money-denominated prices.
The present set of circumstances can't persist beyond the very
short-term (the next few weeks). If equities and commodities continue
to rise in anticipation of monetary inflation, then interest rates will
soon begin to rise and Treasury Bonds to fall. On the other hand, more
evidence of economic weakness or the inevitable return of financial
crisis associated with the "PIIGS" governments would probably bring
about more upside in T-Bonds and cause sharp declines in equities and
industrial commodities. A third possibility is that the Fed will become
sufficiently worried by the way the markets are front-running its next
round of "quantitative easing" that it will officially put QE2 on hold,
thus prompting declines in everything that has recently been rising.
The point is that something will soon have to give. It is not possible that everything will continue to levitate.
Oil Update
The
following chart shows that the oil price keeps moving in lockstep with
the US stock market. Most recently, the stock market's rebound from its
late-August low was accompanied by an oil market rebound.
The past month's
strength in the stock market has changed the look of oil's chart, in
that what had earlier looked like a multi-month topping pattern now
looks more like a consolidation within a continuing intermediate-term
advance.
Oil's fundamentals don't seem to matter at this time. Regardless of oil
supply and commercial demand, if the stock market rises to test its
April peak over the next two months (an outcome that now appears to be
likely) then the oil price will stand a good chance of making a new
high for the year. Additionally, the oil market will probably reach an
important peak within a few weeks of the stock market doing the same.
Government Debt Clock
This is interesting:
http://www.economist.com/content/global_debt_clock&fsrc=nwl
Not sure about the debt figures, though. For example, US public debt is
shown as $8.5T on the above-linked page, but it is actually around
$13.6T (refer to http://www.treasurydirect.gov/NP/BPDLogin?application=np for the exact amount).
The Stock Market
The
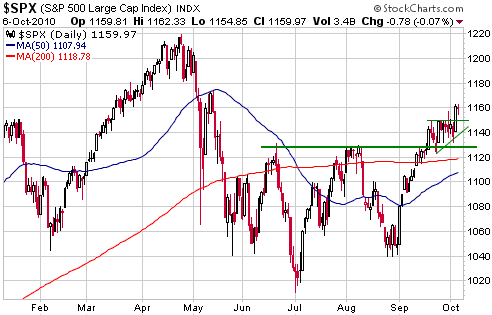
S&P500 Index (SPX) broke above the top of a little consolidation
pattern on Tuesday. This mini-breakout suggests a measured objective of
around 1175, but it now looks like a test of the April high (1220) lies
in store.
The stock market's
rebound has created the impression that various risks, such as the risk
of another large economic downturn in the US or a government debt
crisis in Europe, have dissipated, but this impression isn't correct.
All the fundamental problems and risks that existed two months ago are
still in existence; all that's happened is that prices have risen on
the back of monetary inflation or anticipated monetary inflation. This
is probably not be a great time to be making bearish bets, but it is
definitely not a great time to be ploughing money into investments
predicated on recovery/stability persisting beyond the short-term.
Gold and
the Dollar
Gold and Silver
The US$ gold price has now trended upward for 50 trading days without
experiencing a single daily decline in excess of 1%. We are still
anticipating a pullback to the vicinity of the 50-day moving, and we
are also expecting an increase in volatility.
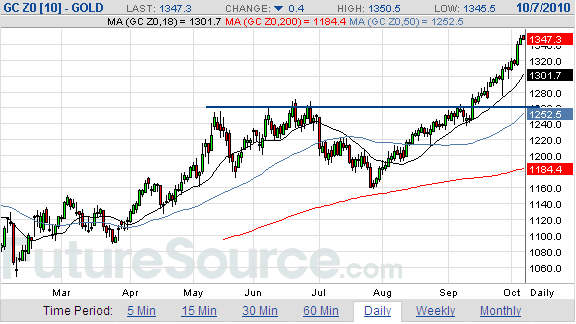
The following daily chart of the December gold futures contract shows
that the 50-day moving average has just moved up to the low-$1250s and
that there is well-defined lateral support at around $1260. Regardless
of whether or not the gold futures market extends its advance by a few
more days, this support will be a likely target for the next
correction.
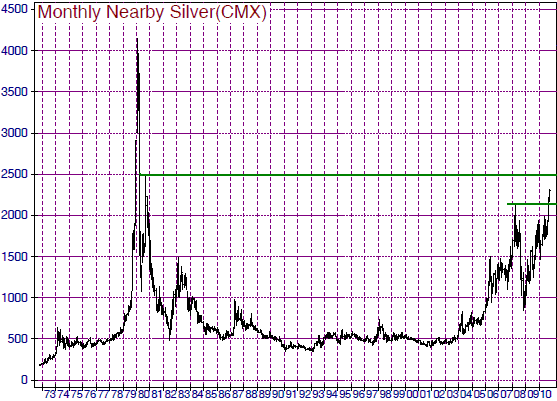
Silver has just
broken decisively above its March-2008 peak, which means that it is now
at its highest level since 1980 and that in order to identify a
chart-based resistance level we must look at a chart that goes back
more than 30 years. The following monthly chart from www.mrci.com
fits the bill. It suggests that resistance will be encountered at $25
(the peak of the rebound that followed the early-1980 crash).
With silver having already come this far, it will likely go a bit
further and test resistance at $25 within the next two months. Whether
it continues beyond that is anybody's guess, but we would probably view
a rise to $25 later this year as an invitation to purchase some more
insurance in the form of put options.
Gold Stocks
Recap and Overview
The gold sector, as represented by the HUI, made a major low on 24th
October 2008 and tested its low on 20th November 2008. It is now
obvious to every man and his dog that October-November of 2008 was a
wonderful time to be buying gold stocks, but who, apart from the few
fanatics who are always bullish on gold stocks come hell or high water,
thought it was a wonderful buying opportunity in real time? We did.
Here are some excerpts from the TSI commentaries posted when the gold
sector was bottoming in 2008:
a) In the 20th October 2008 Weekly Update we wrote: "The
gold sector is now at its most oversold extreme ever..." and "... this
month's low will probably be the major variety (the type that sets the
stage for a multi-year bull market)...".
b) In the 22nd October 2008 Interim Update we wrote: "...the longer-term outlook for gold and gold stocks is an order of magnitude more bullish today than it was in October of 1987" and "...the sharp rebound that follows the 2008 crash should prove to be the first leg of a new cyclical bull market".
c) In the email alert sent on 21st November 2008 we wrote: "Perhaps
there will be 1-2 more days of pain before the gold sector begins to
rally, but whether it begins today (Friday) or early next week we
suspect that the coming rally will be explosive".
d) In the 24th November 2008 Weekly Update we wrote: "The
similarities with the early 1930s potentially pave the way for a more
consistent upward trend in the gold sector over the next two years than
was seen during the two-year periods following the corrections of the
late-1960s and mid-1970s. In any case, regardless of whether we are
talking 1930s or 1970s we should now be in the early part of a new
multi-year upward trend in the gold sector".
e) In the 26th November 2008 Interim Update we wrote: "...we
not only view the break above 225 as confirmation that a short-term
bottom was put in place last month; we view it as confirmation that a
new 4-5 year bull market has begun. As mentioned earlier in today's
report and in previous commentaries, the gold sector's fundamentals
were improving over the past few months even while stock prices were
getting hammered in response to the global de-leveraging. This suggests
that the gold sector has a lot of catching up to do over the months
ahead."
It's too early to tell whether the prediction of a new 4-5 year bull
market will prove to be accurate. Due to this week's move by the HUI
above its December-2009 peak, what we can unequivocally state at this
time is that a new bull market of at least 2 years duration began in
October of 2008. In any case, the point isn't that a particular
prediction proved to be close to the mark. As we've noted many times
over the years, it's an ill-conceived investment approach that relies
on being able to consistently predict specific market outcomes. A much
better approach involves having a good general understanding of what's
likely to happen in the financial world over the long-term and to let
this general understanding be a rough guide to overall positioning, but
to base specific buy/sell decisions on real time information and
analysis. For example, in October-November of 2008 there was no need to
even have an opinion on what was likely to happen over the ensuing few
years; the combination of valuation and sentiment measures made it
crystal clear that a great buying opportunity was at hand.
The more extreme the situation in terms of valuation and sentiment, the
more clear-cut the appropriate investing and speculating decisions.
However, most of the time the situation is not extreme. Most of the
time the risk/reward is nowhere near as skewed towards reward as it was
for the average gold stock in Q4-2008, or as skewed towards risk as it
was for the average tech stock in Q1-2000.
With regard to the gold sector, now is one of those times when the
situation is far from extreme. We think the risk/reward is skewed
towards reward across all timeframes, but to nowhere near the extent it
was in late 2008. A lot of upside potential remains, although the bulk
of the really low-risk money has been made. This is especially the case
at the junior end of the market, where you could buy gold in the ground
for literally nothing towards the end of 2008 (many exploration-stage
miners with proven gold resources were trading below their cash values
at that time). There are plenty of juniors that still trade at very
attractive valuations considering the price of gold, but downside risk
is generally a lot higher today than it was back then.
Something we must bear in mind is that at some point over the next few
years valuations will probably become as crazy on the upside as they
were on the downside in late 2008. We would like to avoid getting
involved in a "greater fool" game, but we would also like to avoid
making a complete exit during the early phase of a mania.
Current Market Situation
The HUI finally broke above major resistance at 520 during the first
half of this week. To confirm the breakout it needs to end the week
above this resistance.
The 50-day moving average remains the most likely target for the next
short-term correction. It is now at 480 and continues to rise.
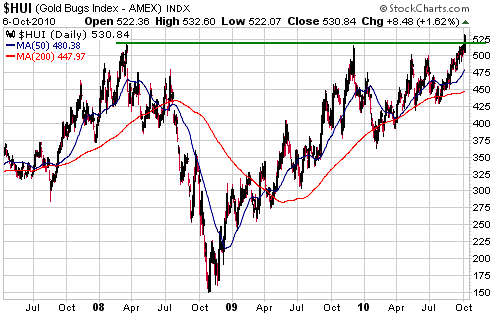
It's remarkable that
the HUI first reached 520 in March of 2008 when the gold price was
$1025, and that it took a rise in the gold price to $1340 to finally
push the HUI above 520. This dramatic relative under-performance on the
part of the HUI can largely be explained by the extent to which some of
the senior gold stocks were over-valued in March of 2008, but the
result is that gold shares are now generally under-valued relative to
gold bullion.
The chart-based objectives for the HUI suggested by this week's upside
breakout are 650 and 900. 650 looks like a reasonable 6-12 month
objective, but it will probably take the HUI a few years to reach 900.
Currency Market Update
The last two intermediate-term bottoms for the Dollar Index were in
November of 2009 and April of 2008. Interestingly, the following chart
shows that an intermediate-term peak in the British pound preceded each
of these Dollar Index bottoms by 3-5 months. In other words, over the
past few years the pound has tended to peak against the US$ well ahead
of most other major currencies. This makes sense because the pound is
fundamentally the weakest of the major currencies.
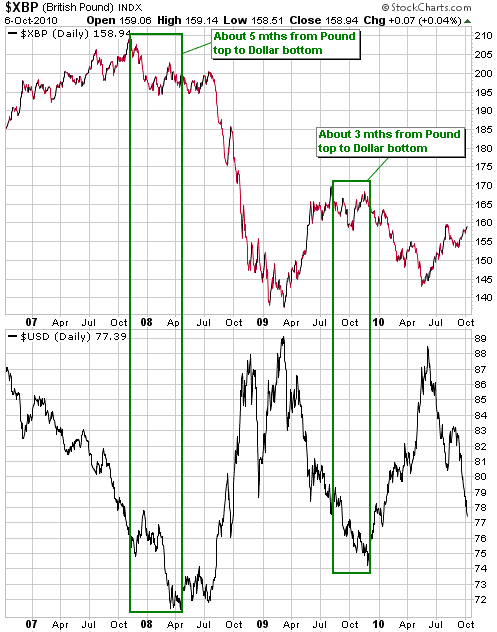
Due to its
fundamental weakness, there's a good chance that the pound will once
again peak well ahead of most other major currencies; that is, that an
intermediate-term peak in the pound will lead an intermediate-term
bottom in the Dollar Index. In fact, it is possible that the pound
reached its peak two months ago.
Further to the above, we will be watching the pound more closely than
usual over the weeks ahead. If it is able to exceed its August high at
some point it will be a sign that the US dollar's downward trend is
likely to continue into early 2011, but if it fails to make a new
multi-month high and then takes out its early September low it will be
a sign that the US dollar's next intermediate-term low will likely be
in place before year-end.
Update
on Stock Selections
(Notes: 1) To review the complete list of current TSI stock selections, logon at http://www.speculative-investor.com/new/market_logon.asp
and then click on "Stock Selections" in the menu. When at the Stock
Selections page, click on a stock's symbol to bring-up an archive of
our comments on the stock in question. 2) The Small Stock Watch List is
located at http://www.speculative-investor.com/new/smallstockwatch.html)
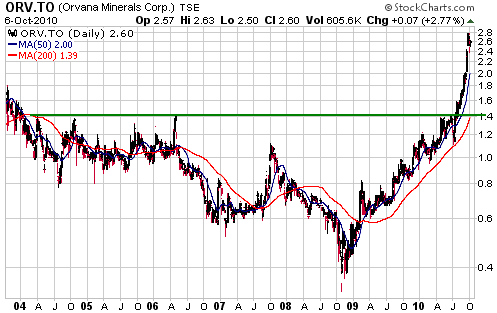
 Orvana Minerals (TSX: ORV). Shares: 115M issued, 119M fully diluted. Recent price: C$2.60 Orvana Minerals (TSX: ORV). Shares: 115M issued, 119M fully diluted. Recent price: C$2.60
The report by O B Research linked HERE contains a detailed analysis of ORV and arrives at an intermediate-term valuation-based target of C$4.20 for the stock.
We are comfortable with the above-mentioned valuation. In our opinion,
the company's gold-producing assets (100K-oz/yr from a project in Spain
and 20K-oz/yr from a project in Bolivia) are conservatively worth
around C$3.00/share. The company will also have annual copper
production of 28M pounds beginning next year, which is probably worth
about $1.00/share. Lastly, the exploration-stage Copperwood copper
project in the US should be worth at least C$0.20/share.
As is the case with quite a few other junior gold/silver stocks, ORV's
problem is that it has run up very quickly over the past couple of
months (refer to the following chart). This increases the risk of a
sizeable downward correction, so although ORV still offers good value
we wouldn't do any new buying unless it pulled back to around C$2.00.
 Ideas for new buying Ideas for new buying
We prefer to buy stocks BEFORE they 'go vertical', not after. This
generally means buying stocks that are not the current focus of the
market's attention, or buying stocks that have hit a temporary
obstacle. For example, NXG hit a temporary obstacle last week in the
form of a convertible debt financing. This financing will help the
company over the coming 1-2 years, but it created short-term downward
pressure.
Other gold/silver stocks that are reasonable candidates for new buying
near their current prices are ADM.V, CFO.V, GOZ.TO and THM. The Franco
Nevada warrants (TSX: FNV.WT) and the Kinross Gold D-Series warrants
(TSX: K.WT.D) also look like good speculations at this time.
Chart Sources
Charts appearing in today's commentary
are courtesy of:
http://stockcharts.com/index.html
http://www.futuresource.com/

|

