![]()
![]()
![]()
![]()
- Interim Update 6th December 2017
Copyright
Reminder
The commentaries that appear at TSI
may not be distributed, in full or in part, without our written permission.
In particular, please note that the posting of extracts from TSI commentaries
at other web sites or providing links to TSI commentaries at other web
sites (for example, at discussion boards) without our written permission
is prohibited.
We reserve the right to immediately
terminate the subscription of any TSI subscriber who distributes the TSI
commentaries without our written permission.
The yield curve and the
boom-bust cycle
The central bank is not the root
cause of the boom-bust cycle. The root cause is fractional reserve banking
(the ability of banks to create money and credit out of nothing). The
central bank's effect on the cycle is to extend the booms, make the busts
more severe and prevent the investment errors of the boom from being fully
corrected prior to the start of the next cycle. Consequently, there are
some important relationships between interest rates and the performance of
the economy that would hold with or without a central bank, provided that
the practice of fractional reserve banking was widespread. One of these
relationships is the link between a reversal in the yield curve from
flattening to steepening and the start of an economic
recession/depression.
Unfortunately, the data we have at our
disposal doesn't go back anywhere near as far as we'd like, where "as far
as we'd like" in this case means 150 years or more. For example, the data
we have for the 10year-2year spread, which is our favourite indicator of
the US yield curve, only goes back to the mid-1970s.
For a
longer-term look at the performance of the US yield curve the best we can
do on short notice is use the Fed's data for the 10year-3month spread,
which goes back to the early-1960s. However, going back to the early-1960s
is good enough for government work and is still satisfactory for the
private sector.
As explained in many previous commentaries, the
boom phase of the cycle is characterised by borrowing short-term to
lend/invest long-term in order to take advantage of the artificial
abundance of cheap financing enabled by the creation of money and credit
out of nothing. This puts upward pressure on short-term interest rates
relative to long-term interest rates, meaning that it causes the yield
curve to flatten.
At some point, usually after the boom has been in
progress for several years, it becomes apparent that some of the
investments that were incentivised by the money/credit inflation were
ill-conceived. Losses start being realised, the quantity of loan defaults
begins to rise, and the opportunities to profit from short-term leverage
become scarcer. At this point everything still seems fine to casual
observers, central bankers, the average economist and the vast majority of
commentators on the financial markets, but the telltale sign that the
cycle has begun the transition from boom to bust is a trend reversal in
the yield curve. Short-term interest rates begin to fall relative to
long-term interest rates, that is, the yield curve begins to steepen.
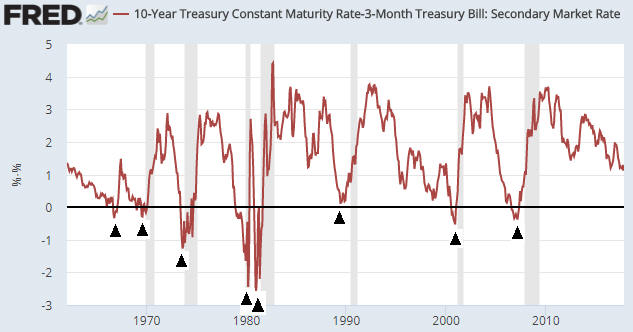
The following monthly chart of the 10year-3month spread illustrates
the process described above. On this chart, the boom periods roughly
coincide with the major downward trends (the yield-curve 'flattenings')
and the bust periods roughly coincide with the major upward trends (the
yield-curve 'steepenings'). The shaded areas are the periods when the US
economy was officially in recession.
The black arrows on the chart
mark the major trend reversals from flattening to steepening. With two
exceptions, such a reversal occurred shortly before the start of every
recession.
The first exception occurred in the mid-1960s, when a
reversal in the yield spread from a depressed level was not followed by a
recession. It seems that something happened at that time to suddenly and
temporarily elevate the 10year yield relative to the 3month yield.
The second exception was associated with the first part of the famous
double-dip recession of 1980-1982. Thanks to the extreme interest-rate
volatility of the period, the yield spread reversed from down to up
shortly before the start of the recession in 1980, which is typical, but
during the first month of the recession it plunged to a new low before
making a sustained reversal.
Due to the downward pressure being maintained on short-term interest
rates by the Fed, the yield curve reversal from flattening to steepening
that signals an imminent end to the current boom probably will happen with
the above-charted yield spread at an unusually high level. We can't know
at what level or exactly when it will happen, but it hasn't happened yet.
Copper tanks
There was a false upside
breakout in the copper price in mid-October. We mentioned in the 30th
October Weekly Update that something similar happened early in the year
when the copper price broke above its November-2016 high and then almost
immediately resumed a downward correction. Our view was that the
corrective process probably wouldn't end until the price had dropped to
near its 200-day MA.
The copper price plunged on Tuesday of this
week, but it is still about $0.15 above its 200-day MA. Also, the 200-day
MA now coincides with lateral support in the low-$2.80s, which makes the
low-$2.80s a reasonable target for a correction low.
Tuesday's price plunge was blamed on reduced Chinese demand for
copper, but it was more likely related to the liquidation of speculative
long positions. Speculative buying pushed up the prices of both copper and
nickel to levels that weren't supported by underlying demand for the
physical metals, so there is no reason to point to economic developments
in China to explain the recent price declines.
Also, the commodity
world is immersed in a broad consolidation that may extend into
January-February. This should be taken into account before looking for
news to explain the price weakness in any single commodity.
The Stock Market
The temporary suspension of the
US debt ceiling that was agreed in September ends on Friday 7th December,
meaning that the US federal government won't be able to add to its total
quantity of borrowings from 8th December until a new agreement (another
temporary suspension or the lifting of the ceiling) is reached.
The
stock market doesn't appear to be concerned about the risk of a US
government shutdown, and there's no reason it should be. The debt ceiling
will be lifted eventually and in the meantime the Treasury has the ability
to keep the wheels of government turning for at least two months by
drawing down its cash reserve ($178B at last count) and using some
accounting tricks.
In any case, with the US stock market stretched
to the upside by every measure and with the true fundamentals having
deteriorated over the past month it won't take a specific event to bring
on a multi-month correction. It will happen of its own accord.
The
increasing 2-way volatility of the past several days could be a warning
that the trend is in the process of changing, but with the upward trend
having extended so far into the year it would be no surprise if it
continued until year-end. In this case there would be a good chance of a
correction beginning in early-2018.
Gold and the Dollar
Gold
Revisiting the 15-year cycle
In
last week's Interim Update, we wrote:
"If the pattern (major
low followed by relatively minor low followed by major low and so on)
continues then 2015 was akin to 1985 and the next major [gold] rally will
begin around 2030."
And:
"The 15-year cycle low of
1985 was followed by a rally that lasted 2 years and nine months. If we
are now dealing with something similar then the rally that began in
December-2015 will end during the second half of next year."
Bearing in mind that a lot more emphasis should be placed on real-time
analysis of fundamentals, sentiment and technicals than on historical
comparisons, we thought it would be interesting to consider this 'what if'
scenario: What if the gold rally from the December-2015 low is evolving in
a roughly similar manner to the gold rally that began in March-1985?
The twists and turns of the 1985-1987 rally and the post-December-2015
rally don't have much in common, but in broad-brush terms the current
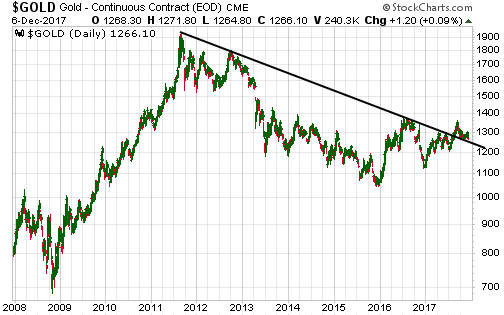
situation is potentially equivalent to either Q2-1986 or Q1-1987.
The argument in favour of Q2-1986 revolves around the position of the
price relative to the long-term downward-sloping trend-line. Specifically,
in Q2-1986 the gold market was immersed in its first significant
correction following a break above the trend-line dating back to the 1980
high, and it could be argued that the gold market is presently immersed in
its first significant correction following a break above the trend-line
dating back to the 2011 high. Refer to the following charts for more
detail.
The argument in favour of Q1-1987 is stronger. It revolves
around the amount of time that has lapsed since the 15-year cycle low and
the performances of inter-related markets. Specifically, Q1-1987 was 2
years after the 15-year cycle low, which is where we are today, and also
when a multi-quarter surge in interest rates got underway, which could be
where we are today.
Our gold market analysis won't be based in any way on the 1985-1987
comparison unless the gold price moves above its 2017 high within the
coming few months, at which point the comparison could be very relevant.
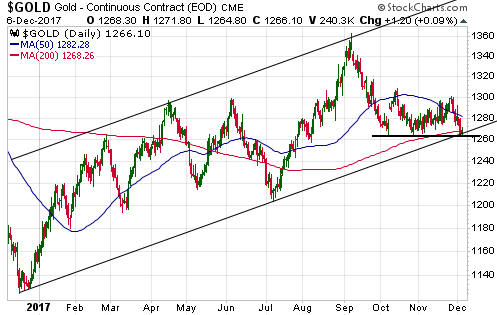
Current Market Situation
We've
been warning that before the next substantial gold rally gets underway
there may have to be a sharp decline -- likely to the low-$1200s -- to
flush out the leveraged speculators who have stubbornly clung to their
long positions. It looks like the flushing-out process has begun, although
the gold price continues to hold above support in the low-$1260s. This is
probably because the fundamental backdrop remains slightly supportive.
We'll take the evidence as it comes, but our guess at this time is
that the next multi-month bottom for the gold price will happen during
January or February of next year. However, if there's a sharp decline
ahead of or in the immediate aftermath of the Fed's 13th December
rate-hike announcement (a December rate hike has been a foregone
conclusion for at least the past 2 months) then a multi-month price bottom
could occur as soon as next week.
Silver
Gold is not yet 'oversold' in momentum terms, but that's not the case with
silver. The silver price is now sufficiently 'oversold' to suggest that
some sort of bottom is close at hand, at least in terms of time. That
being said, during the April-May sell-off the silver market became far
more 'oversold' than it is today.
Right now silver is on a 7-day
losing streak and has a daily RSI(14) of 30.8, whereas at the multi-week
price bottom in early-May it had just fallen for 11 trading days in a row
and had a daily RSI of only 17.4. Significant additional near-term
weakness is therefore well within the realm of possibility.
We'll be paying close attention to silver's COT data over the weeks
ahead in an effort to identify a tradable low. A 2-3 week price rebound
could occur without a bullish signal from the COT data, but to set the
stage for a multi-month rally there probably will have to be a complete
sentiment reset.
Gold Stocks
From the
latest Weekly Update:
"We don't see a good reason to believe
that a general increase in demand for gold-mining stocks is about to
happen. Instead, a general increase in demand probably requires a
preceding capitulation -- the capitulation of bullish speculators in gold
futures and the capitulation of gold-mining investors who are holding in
expectation of the big rally that is supposed to begin in December."
A capitulation has begun. Looking at the glass as being half full,
although this results in short-term pain it is good news because it gets
us closer to the point where the stage is set for a tradable rally.
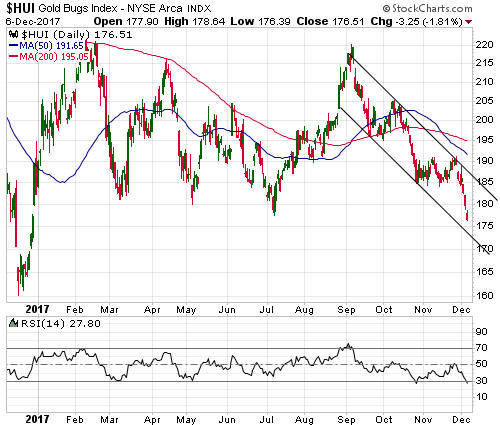
In last week's Interim Update and again in the latest Weekly Update we
noted that a break below the bottom of the HUI's recent 5-point range
(185) probably would lead to a quick decline to near the July low (177)
and could also pave the way for a test, within the ensuing 1-2 months, of
the December-2016 low (160).
The bottom of the 5-point range was
breached on Monday of this week and the July low is already being tested.
In fact, on Wednesday 6th December the HUI fell below its July low to a
new low for the year.
There appears to be channel support at around
172 (see chart below), but the next clear-cut support is the December-2016
low at 160. We think that this support defines the short-term downside
risk.
The waters are muddied a little by a conflict between the chart
patterns of the HUI and the Gold Miners ETF (GDX). Whereas the HUI made a
new low for the year on Wednesday, GDX is still comfortably above support
defined by its May and July lows. Also, at this time it doesn't look like
GDX has a realistic chance of falling as far as its December-2016 low
($18.50) prior to a multi-month bottom.
Although it's hard to believe that the gold-mining indices and ETFs
will bottom prior to the bullion market making a sustainable low, the way
things currently stand a December low is a more likely prospect for the
gold-mining sector than for gold bullion.
The Currency
Market
The following chart compares the euro (the blue
line) with the interest-rate differential that exerts the greatest
influence on the euro/US$ exchange rate. The message is that the euro is
presently a lot higher than it should be given the current difference
between Germany and US 10-year bond yields.
We expect the euro to
trade significantly lower within the next two months.
Updates on Stock Selections
Notes: 1) To review the complete list of current TSI stock selections, logon at
http://www.speculative-investor.com/new/market_logon.asp
and then click on "Stock Selections" in the menu. When at the Stock
Selections page, click on a stock's symbol to bring-up an archive of
our comments on the stock in question. 2) The Small Stock Watch List is
located at http://www.speculative-investor.com/new/smallstockwatch.html
Chart Sources
Charts appearing in today's commentary
are courtesy of:
http://stockcharts.com/index.html
http://research.stlouisfed.org/
![]()