|
- Interim Update 7th January 2004
Copyright
Reminder
The commentaries that appear at TSI
may not be distributed, in full or in part, without our written permission.
In particular, please note that the posting of extracts from TSI commentaries
at other web sites or providing links to TSI commentaries at other web
sites (for example, at discussion boards) without our written permission
is prohibited.
We reserve the right to immediately
terminate the subscription of any TSI subscriber who distributes the TSI
commentaries without our written permission.
Greenspan
and Bernanke
In a speech on 3rd January Alan Greenspan
gave himself and the Fed a big 'pat on the back' when he said: "There
appears to be enough evidence, at least tentatively, to conclude that our
strategy of addressing the bubble's consequences rather than the bubble
itself has been successful. Despite the stock market plunge, terrorist
attacks, corporate scandals, and wars in Afghanistan and Iraq, we experienced
an exceptionally mild recession--even milder than that of a decade earlier."
Was this pat on the back deserved?
The short answer is no because the
bubble's consequences haven't been addressed at all; they've just been
pushed into the future. In fact, the credit bubble is bigger now than it
was when the NASDAQ reached its peak in March of 2000. The prices of most
tech and telecom stocks are now a lot lower than they were in 2000 and
aren't likely to move to new highs anytime this decade, but the money borrowed
into existence as a result of the Fed's desperate attempts to postpone
the consequences of the bubble has had dramatic effects throughout the
markets and the economy. For example, it has pushed many non-tech shares
to new all-time highs, caused an over-heated real estate market to become
even hotter, started a commodities' boom, and caused the already-large
current account deficit to balloon. Furthermore, at 1.8% the personal savings
rate in the US -- which was 8% at the end of the 1991 recession and 12%
at the end of the 1982 recession -- is near an all-time low and consumer
debt (excluding mortgages) is about $18,700 per household.
None of these things appear to be problems
at the moment because almost everyone is making money. What it all means,
though, is that the real 'bubble bursting' is yet to come and might have
to be dealt with by the next Fed Chairman.
Fed Governor Ben Bernanke also made
a speech on 3rd January, the key points of which were:
- Inflation is low (almost too
low), permitting the Fed to pursue an accommodative monetary policy for
a long time to come
- The Dollar's decline is not
a cause for concern
- Rises in the prices of raw
materials are not a cause for concern because they are unlikely to result
in appreciably higher consumer prices (the implication being that no amount
of dollar devaluation relative to commodities is a problem unless it is
accompanied by a large rise in the CPI)
Therefore, once again the Fed appears
to have given investors in gold and commodities a 'green light'.
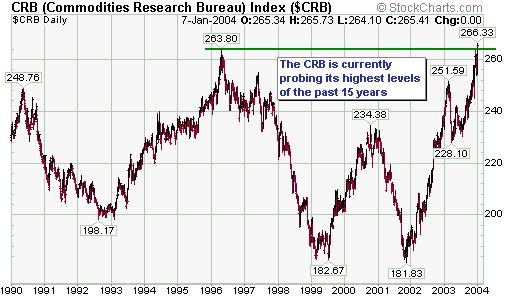
During the first quarter of 2002 we
speculated that the CRB Index would have to rise above its Year 2000 high
of 235 before most people would begin to recognise the inflation problem.
When this happened and there was still minimal concern about inflation
we speculated that a move above the 1996 high might be needed. However,
the CRB is now testing its 1996 high (see chart below) while the Fed tells
us that, if anything, inflation is too low. And more importantly, most
people seem to believe them. So it now looks like a move to a new all-time
high by the CRB Index (a move above the 1980 peak of around 340) will be
needed to bring about widespread recognition of the inflation problem.
It is worth reiterating at this point
that regardless of what the Fed tells us it is going to do on the interest
rate front the bond market will ultimately determine what it actually does.
In other words, regardless of what is happening with GDP growth or employment
growth or capacity utilisation or the CPI or anything else, the Fed will
only be able to keep the Fed Funds Rate near the current low level if long-term
interest rates remain near their lows. Does anyone really think that if
the yield on the 30-year bond moves above 6% and begins charging towards
7% that the Fed is going to sit back and say things like "monetary policy
will remain accommodative for the foreseeable future"?
And herein lies the biggest longer-term
risk for investors in commodities and gold. As long as the bond market
behaves then the Fed can afford to remain 'loose' and commodity prices
will have considerable upside potential (which, of course, doesn't preclude
normal corrections). However, once the bond market breaks down then the
longer-term downside risk in commodities (and gold) will increase.
We'll talk more about bonds in the
next Weekly Update because the performances of a lot of different markets
over the coming 6-12 months will hinge on what happens to bonds.
The US
Stock Market
Current Market Situation
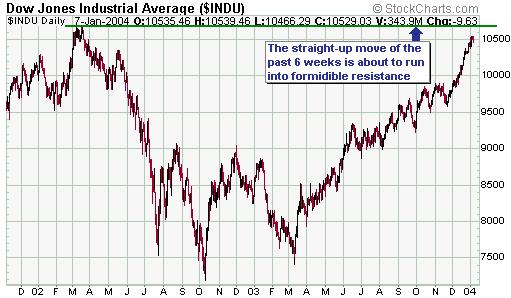
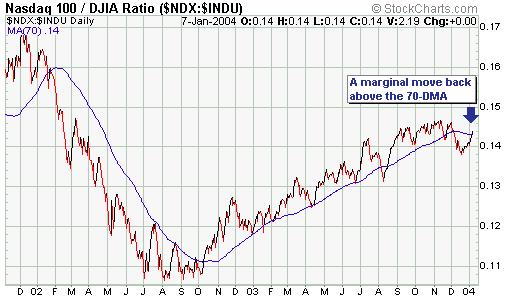
Below are charts of the Dow Industrials
Index and the NDX/Dow ratio. With the Dow nearing major resistance defined
by its March-2002 peak we considered adding a second bearish position (a
second position in USPIX) to the TSI Stocks List, but as a result of yesterday's
move in the NDX/Dow ratio to above its 70-day moving average we will hold-off
on doing so. It is quite likely that this recovery in NDX/Dow will prove
to be a head fake and that we'll get a downward reversal within the next
few days, but in this situation we'd rather react to a price reversal than
try to anticipate one.
In the absence of an external shock
such as a terrorist attack we don't think there will be a large decline
in the stock market during the first quarter of this year. We do, however,
think there's a reasonable chance of a peak during January (most likely
the first half of January) and that this peak could turn out to be the
ultimate top for the rally that began in October of 2002. Even if this
proves to be the case, though, markets typically don't reach a major peak
and then immediately capitulate. Instead, the initial decline is usually
bought because most people see the first drop in a new downward trend as
a normal pullback within a continuing upward trend, and this causes the
market to retrace 50%-100% of its initial decline. It is generally only
after the market makes a secondary (lower) peak and then breaks below the
low of its initial decline that panic sets in and price starts to drop
at an accelerated pace. Therefore, even if the stock market were to peak
within the next week or so we'd probably get a re-test of the peak late
this quarter with the accelerated stage of the decline not getting underway
until at least April. This is, by the way, one of the reasons why we think
the trend in the gold sector will remain positive until at least April-May
(the gold sector tends to peak after the broad market).
Further to the above, while we think
it is reasonable to have already taken an initial bearish position on the
market we don't think it makes sense to be aggressively bearish at this
time. As a major top develops there are usually a few good opportunities
to 'get short'.
Gold and
the Dollar
Gold Stocks
Sitting tight in a bull market
Gold stocks are probably in a long
term bull market; one that is likely to continue for another 5 years or
more. An argument could therefore be made that the best approach would
be to just buy the stocks with the aim of holding for several years. In
fact, this might be a viable option for some people. However, whether it
is or isn't a viable option will depend, amongst other things, on a person's
total exposure to the gold sector. For example, we understand that Richard
Russell has recommended that gold stocks be bought and held as long as
the primary trend in the sector remains up and that he has suggested allocating
about 15% of one's investment capital to gold stocks (with the actual amount
depending, of course, on each individual's risk tolerance). The reason
for simply buying and holding the stocks, as opposed to trading in and
out, is that the long-term upside risk is much greater than the downside
risk and that if you attempt to trade the intermediate-term swings in the
stocks you might end up losing your position at what later proves to be
an inopportune time.
We certainly don't disagree with Mr
Russell's line of thinking in this matter because in the current environment
a 15% exposure to gold stocks would, in our opinion, constitute a minimum
position. However, we get the impression that some of our subscribers have
more than 50% of their portfolios dedicated to gold stocks. In general,
while it might be appropriate for someone with a 15% exposure to the gold
sector to just sit tight and ride-out whatever pullbacks come his/her way,
for someone with, say, a 60% exposure to the sector a different approach
would probably be more appropriate.
Because our readership comprises people
with diverse backgrounds, financial situations, goals and expertise, it
is not possible for us to provide specific trading/investment advice that
is going to suit everyone all the time. What it is possible for us to do,
and what we endeavour to do, is provide risk/reward analysis covering all
terms (short, intermediate and long). We also have a stock selections list,
the main purpose of which is to provide a way of quantifying the success
and practicality of our analyses. It is ultimately up to each of our readers,
though, to decide how the information presented at TSI can best be put
to use as far as their own situations are concerned.
If, for example, someone has minimal
exposure to gold stocks (15% or less) and a sharp correction wouldn't cause
them significant stress then they might choose to ignore us on those occasions
when we point out that the short-term risk/reward ratio for the gold sector
has become unattractive (such as now, for instance). In fact, someone with
almost no exposure to the gold sector might even decide to do a small amount
of buying -- for insurance purposes -- at a time when the short-term risk/reward
is poor; which is why we've continued to highlight buying opportunities
in individual gold stocks over the past several weeks despite our concerns
regarding market risk. On the other hand, someone with such a large exposure
to the gold sector that a sharp pullback would cause them considerable
emotional and/or financial stress might decide to do some selling when
our analysis indicates that the short-term downside risk exceeds the likely
upside.
Another example of how it would be
appropriate for different people to use the same information in different
ways relates to some of the junior gold and resource stocks that have been
added to the TSI Stocks List. Over the past year we've focused a great
deal of attention on the exploration/development-stage juniors because
this was the area that appeared to offer the best risk/reward (and still
does, by the way). However, if holding volatile stocks makes you nervous
then you should steer clear of the juniors, or, at least, limit your total
exposure to this group to a small portion of your portfolio.
Gold sector sentiment
According to newsletter surveyor Mark
Hulbert, only about 11% of gold newsletter writers are currently bullish.
However, we don't know if this is significant because we have not seen
a long-term chart comparing the results of Hulbert's survey with the gold
price and we know that this particular survey has -- when used as a contrary
indicator -- been misleading at important turning points in the past. In
other words, we have no basis on which to draw any conclusions from the
results of Hulbert's recent survey. Furthermore, sentiment is not always
a contrary indicator; as to whether it is or not depends on whose sentiment
we are talking about.
Based on the surge in the prices of
most gold stocks relative to the price of gold we can safely assume that
equity-market participants were very bullish on gold at the early-December
peak. It is normal (and bullish) for the prices of gold shares to rise
at a faster rate than the price of gold in a gold bull market due to the
leverage offered by most gold stocks, but intermediate-term peaks in the
gold stocks tend to occur when the stocks move too high and too fast relative
to bullion or when they start to break-down relative to bullion. This is
why we focus on the HUI/gold ratio relative to its 40-day moving average.
Our analysis indicates that important peaks in the gold sector can be identified
by a surge in HUI/gold to well above its 40-day MA (pointing to excessive
optimism) or a decisive break below this moving average (pointing to a
reversal in sentiment). At this stage we have what appears to be a reversal
in sentiment and we've taken this to mean that the short-term risk is high.
There is, however, sentiment evidence
to suggest that the early-December peak -- or this month's peak if gold
stocks manage to move to new highs in the near-term -- will not turn out
to be a major peak. For example:
a) Some popular gold stocks are clearly
well ahead of themselves, but many of the exploration/development-stage
juniors are still trading as if the gold price was $350. It would be unusual
for a major peak to occur prior to there being rampant speculation that
takes the junior stocks to levels where they are discounting a substantial
increase in the gold price.
b) Although at a high level, the net-long
position of the small traders in COMEX gold futures is lower than it was
early in 2003 when gold was trading in the 370s. The small traders ARE
a reliable contrary indicator and it is bullish that they are less optimistic
now than they were 12 months ago. Note, though, that this is more of a
positive for gold than for the shares of gold mining companies.
Summary
Our assessment is that the positive
trend in the gold sector will remain intact for at least another 4-5 months
and that the stocks of the exploration/development-stage companies will
dramatically out-perform during the final few months of the up-trend. We
also expect that the South African and Australian gold shares will out-perform
their North American counterparts during the next rally because gold is
likely to gain ground against both the Rand and the A$ over the next several
months.
Price action since the early-December
peak has, however, been quite bearish and when this price action is considered
alongside the high valuations of many large and mid-tier gold stocks we
think it makes sense to be cautious in the short-term. This doesn't mean
we think that new highs in the HUI are out of the question as far as the
next few weeks are concerned, just that the short-term downside risk appears
to be greater than the short-term upside potential. As mentioned in previous
commentaries, the short-term risk will potentially increase if we move
into the second half of January without the HUI having made a new high.
Gold
We've explained in the past that gold
bullion is a very different investment to gold stocks. Gold stocks are
financial assets just like any other stocks, but gold bullion is money.
Therefore, in investment-portfolio terms we think gold bullion should be
considered as being part of the cash component. So if you have, for example,
a portfolio comprising 30% bonds, 40% stocks, 15% gold bullion, 5% US dollars
and 10% euros, then we would consider the total cash component of your
portfolio to be 30%.
Over the past few years whenever we've
been asked to name our favourite currency our answer has always been gold.
We've favoured some fiat currencies over others, but we've expected that
all the fiat currencies would fall in value relative to gold. And although
there have been lengthy periods over the past few years when gold has under-performed
some of the major fiat currencies, the below chart of the US$ gold price
multiplied by the Dollar Index shows that gold, from a non-US perspective,
has been trending higher since the third quarter of 1999. What actually
happened was that gold moved sharply higher against a basket of non-US
currencies from September of 1999 until the second quarter of 2002, at
which point currencies such as the euro began to appreciate against the
US$ at a similar rate to gold (resulting in a sideways move across the
channel shown on the below chart).
Chart source: http://www.sharelynx.com/
The euro and the other non-US fiat
currencies have some of the same weaknesses as the US$. For example, they
are mostly just book-entries that are created when loans are made and their
supply tends to grow at a much faster rate than the economy (because in
today's world credit usually expands at a faster rate than the economy).
These weaknesses don't always matter as far as the financial markets are
concerned, but when confidence in the reserve currency (the US$) is falling
they tend to become very important.
Because we think confidence in the
reserve currency is now in a long-term downtrend -- effectively casting
a pall over the entire official monetary system -- we expect that gold
will continue to trend higher relative to the fiat currencies. In other
words, gold is likely to remain our favourite currency for a considerable
time.
Current Market Situation
From last week's Interim Update: "Silver
has spiked above the major resistance that exists at 5.80 and it wouldn't
be surprising to see gold spike above major resistance at 420 in the near
future. It would, however, surprise us if these initial thrusts above resistance
proved to be sustainable beyond the very short-term. But regardless of
whether it happens now or in a few months time (following an intervening
pullback), gold and silver look set to move well above the aforementioned
resistance levels."
Earlier this week gold joined silver
by moving above long-term resistance and in doing so it provided further
evidence that a secular bull market is in progress (we didn't really need
any more evidence, but are happy to have it nonetheless). As mentioned
above, though, we doubt that this initial thrust above resistance will
be sustainable. A daily close below $414 (basis the February contract)
would confirm that a correction was underway.
Silver has moved far enough above the
major resistance that existed at 5.80 to open up the possibility of this
former resistance providing good support during any pullback over the next
few weeks. However, silver could drop all the way back to 5.20 without
doing any serious technical damage.
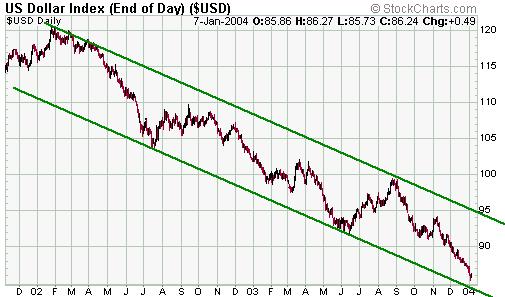
Below is a chart of the Dollar Index
showing the downward-sloping channel that originated around the beginning
of 2002. The Dollar is likely to rebound over the next few weeks before
resuming its decline.
By the way, a few months ago we explained
why the US$ probably wasn't going to reach long-term support in the vicinity
of its 1992-1995 lows (around 80 on the Dollar Index) until near the end
of 2004. However, since that time the Dollar has confirmed that a steeper
downward trend is in force. This, in turn, makes a drop to long-term support
probable before mid-year. Long-term support, though, is only about 6% below
this week's low. This is why, in the latest Weekly Update, we said that
it is no longer appropriate to lean against the dollar from either a short-term
or intermediate-term perspective.
Update
on Stock Selections
 Aquiline
Resource (TSXV: AQI) announced some very good drill results earlier this
week and the stock market responded by pushing the stock to a new high.
AQI has moved up a long way since we added it to the Stocks List about
9 months ago. However, with a current market cap of only C$30M it is still
not expensive considering that the company's Calcatreu project is most
likely going to end up with a high-quality resource of more than 1M ounces.
We will continue to hold. Aquiline
Resource (TSXV: AQI) announced some very good drill results earlier this
week and the stock market responded by pushing the stock to a new high.
AQI has moved up a long way since we added it to the Stocks List about
9 months ago. However, with a current market cap of only C$30M it is still
not expensive considering that the company's Calcatreu project is most
likely going to end up with a high-quality resource of more than 1M ounces.
We will continue to hold.
Corvis
Corp. (NASDAQ: CORV) has moved up quite sharply over the past week, but
still has significant upside potential in the short and the long-term.
We intend to take profits on the stock at around US$3.00.
Most
exploration/development-stage gold companies are highly speculative, which
means that a lot of money shouldn't be risked in any one of these situations.
Rather, risk should be mitigated by spreading exposure across at least
seven and preferably as many as ten of the smaller companies. One exception,
though, is NovaGold (NG on the TSX and the AMEX).
6 months ago, when NovaGold was trading
at around C$3.00, we wrote a piece explaining why we considered this stock
to be an investment-grade opportunity within the junior gold sector. It
has since moved up to C$7.00, but would still make an excellent long-term
investment. In fact, if management executes in accordance with its current
plans -- a very reasonable assumption considering past performance -- then
NG will be trading in the C$40-$50 range in 5 years time assuming NO increase
in the gold price. This valuation is simply based on bringing existing
projects into production and converting existing resources into reserves.
The
stocks of exploration-stage mining companies often lie dormant for months
on end during periods when the companies aren't reporting any news. Therefore,
the best time to buy these stocks is usually just prior to a period when
there is likely to be significant news flow (for example, drill results)
provided you have good reason to expect that the news will be positive.
The worst time to buy them is just after they've rocketed higher in response
to good news (unless you have good reason to think that the market is under-reacting
to the news).
One stock that is currently in the
dormant (no news) phase is Exeter Resource (TSXV: XRC). With a market cap
of less than US$10M XRC is by far the smallest company in the TSI List
and given its small daily trading volume it is not the sort of stock that
will appeal to all of our readers. However, for those who can tolerate
the volatility of a thinly-traded micro-cap this would be a good stock
to accumulate at around the current level (C$1.00). This is because the
company is likely to generate consistent news flow over the next 6 months
(drill results, etc.), causing the market to become more aware of its value.
Chart Sources
Charts appearing in today's commentary
are courtesy of:
http://stockcharts.com/index.html
http://www.futuresource.com/
http://www.sharelynx.com/

|
