|
- 07 March 2001
Economic
Update
The reality of consumer behaviour
versus the perception of consumer sentiment
Since there is a buyer and a seller
in every trade, the total supply of money does not change when assets are
sold. When an asset such as a house or Cisco shares is sold, money is transferred
from the account of the buyer to the account of the seller. The transaction,
in itself, does not alter the total supply of money. The only way
the total money supply can increase is through an increase in debt (for
example, if the purchaser of the asset had borrowed money from a bank in
order to complete the transaction, the money supply would increase).
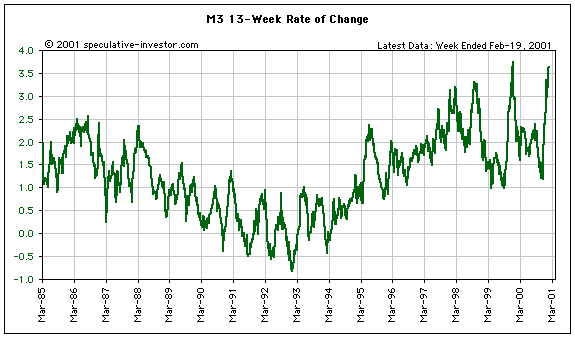
The idea that consumers are 'hunkering
down' has become popular. This view, however, is not supported by the following
chart showing the 13-week rate-of-change of M3 (the total supply of money).
M3 has recently been expanding at a pace that, over the past 15 years,
was only exceeded during the final quarter of 1999. When someone 'hunkers
down', in a financial sense, they do not increase their debt load.
The January Consumer Credit figures,
which were reported on Wednesday, showed that consumer credit increased
by $16B in January (versus a consensus expectation of only $7.5B). This
represents a 13% annualised growth rate. It's just as well consumer sentiment
is falling off a cliff - imagine how much consumers would be borrowing
if they were feeling good about the economy!
The US
Stock Market
Current Market Situation
There is no change to our view as outlined
in the latest WMU. In particular, a rally that brings the market to an
'overbought' condition, but fails to move well above the previous breakdown
area (around 1320 in the nearest S&P500 futures contract), would most
likely be followed by another sharp decline. The rally that began on Monday
has, so far, been unimpressive. We do, however, expect further upside over
the next week.
Gold and
the Dollar
The Dollar versus the Euro
Fiat currencies are not anchored to
anything tangible which means that their relative values can, and often
do, fluctuate wildly. The major central banks hold some gold reserves,
but the amount of gold is very small relative to the number of currency
units. For example, the dollar value of the US' gold reserves amounts to
less than 1% of the total supply of US Dollars. The euro zone has more
gold than the US, but the total amount of gold still only amounts to a
very small percentage of the total money supply (from information available
at the ECB web site, it appears that the total amount of gold in the euro
system is equivalent to around 2% of the total money supply). So, the amount
of 'official sector' gold in the US and in the euro system is not a significant
factor in determining the relative values of the Dollar and the euro. (Note
that 15% of the euro's currency reserves are required to be gold, but total
currency reserves are small in comparison to the total money supply).
Currency market speculation causes
many of the day-to-day fluctuations in the relative values of the various
currencies, but the major trends are determined by trade and investment
capital flows. Despite the huge current-account deficit run by the
US over the past several years, the Dollar remained in a strong up-trend
versus the euro until late October last year. This strength, in the face
of a large and climbing current-account deficit, tells us that current-account
outflows were being more than offset by capital-account inflows. Foreign
investors were eager to take advantage of the superior performance of the
US economy. They bought equities, they bought corporate bonds, they bought
real estate and, most importantly of all, they spent enormous sums purchasing
entire US corporations. Then, two things happened - the US economy began
to slow (removing the economic growth advantage that the US had enjoyed
for many years), and the US stock market stopped going up (in the case
of the NASDAQ, it began falling at a fast pace). Around October/November
last year, due to this change in the investment landscape, the rate at
which investment dollars were flowing into the US dropped below the rate
at which trade dollars were flowing out of the US. As a result, the Dollar
began to trend lower. This new trend will continue until there is a reason
for it not to continue, that is, until:
a) The US economy re-establishes a
growth advantage over Europe, and/or
b) The US economy is once again perceived,
by foreign investors, to offer a superior risk/reward ratio, and/or
c) The current account deficit shrinks
dramatically
A combination of all 3 of the above
will most likely be required to reverse the trend.
Note that the downturn in the US economy
and stock market began during the first half of 2000 while the Dollar did
not peak until the fourth quarter, that is, the Dollar followed the economy
and the stock market with a lag of around 6 months. It is probable that
a similar lag will occur at the completion of the current cycle, that is,
the Dollar will continue to trend lower for several months after the stock
market and the economy have bottomed. If this is the case and the stock
market bottoms in September 2001 (the earliest time we think a major bottom
is possible), then the Dollar's decline will continue until at least the
first quarter of 2002. If the US stock market follows the early-90s Nikkei
pattern then a major bottom will not occur until October 2002 and the Dollar's
downtrend will extend into 2003.
Along the way we'll be paying attention
to various technical indicators in an attempt to time the substantial swings
in the market (volatility will remain high), but the big picture should
always be kept in mind. The big picture is that Oct/Nov 2000 represented
a major turning point in the currency market and, as much as we dislike
the political concoction called the euro, Europe's new currency looks to
be in the early stages of a bull market that should extend for at least
another 12 months. This clearly has important implications for gold in
that a) the gold-dollar and the euro-dollar exchange rates have a strong
positive correlation, and b) gold does not compete with the euro for investment
to anywhere near the extent that it competes with the Dollar.
Current Market Situation
In the latest WMU we mentioned that
a daily close below 110.81 for the March Dollar Index would be needed this
week to confirm that a substantial decline had commenced. The Dollar has
remained comfortably above this level during the first 3 days of the week
and if it continues to do so over the remaining two days then the forecast
sharp decline will likely not begin until late-March. As noted above, we
are confident that the Dollar is headed much lower over the next
12 months, the only question being the path it will follow to get from
where it is now to where it will be at this time next year.
The gold price will benefit from the
falling Dollar and will move much higher over the coming 12 months, but
its performance over the short-term is becoming even more unpredictable
than usual. Normally we would be confident that a firm US$ would keep a
lid on the gold price, but at this time we are not so sure. With lease
rates spiking above 4% on Wednesday there is clearly considerable stress
in the market and a sharp upward move is entirely possible, even if the
Dollar remains firm.
A big test, as far as gold's short-term
future is concerned, will occur during today's trading in New York. The
Bank of England has announced its plan to continue trying to get the lowest
possible price for the country's gold reserves by holding 6 more auctions
of 20 tonnes per auction. The volume of gold involved in the auctions is
insignificant, but the announcement will provide the 'news' to justify
a bear raid. In fact, the stage has already been set. According to 'gold
bear' Andy Smith of Mitsui Global Precious Metals, "this (announcement)
measured around the expectation of a joint statement will disappoint, so
I would expect to see some liquidation"
Bond Market
Update
The T-Bond price remains quite strong
and is trading just below its early-January highs. As we've said on a number
of occasions, we do not expect the Jan-03 peak to be decisively exceeded.
However, if the T-Bond is going to move to a new high then the next 2 months
offer the best opportunity for it to do so.
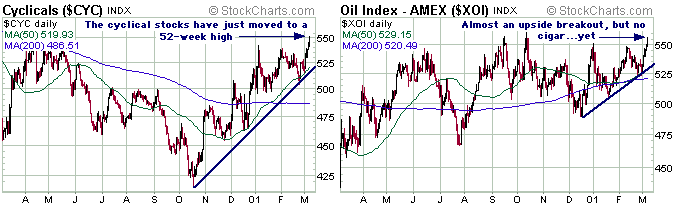
A move to new highs by bonds would
be at odds with the following charts.
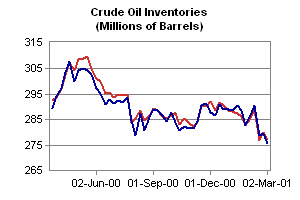
Oil Update
At the end of last week we became short-term
bullish on the oil price, citing constructive price action and inter-market
relationships as the basis for our view. There are, however, three other
reasons to be positive on the oil price at the current time. Firstly, the
traders' commitments are bullish (the Commercials are significantly net-long).
Secondly, with a more hard-line leadership having taken over in Israel
the conflict in the Middle East is likely to get worse before it gets better.
Thirdly, the supply situation continues to deteriorate as illustrated in
the following chart.
Changes
to the TSI Portfolio
No changes.
Administrative
Note
Due to maintenance being carried out
by our web hosting company, access to the TSI site will not be available
from 9.00am to 11.00am (HK time) on Sunday 11th March.

|
