| - Interim Update 7th
March 2007
Copyright Reminder
The commentaries that appear at
TSI may not be distributed, in full or in part, without our written
permission. In particular, please note that the posting of extracts
from TSI commentaries at other web sites or providing links to TSI
commentaries at other web sites (for example, at discussion boards)
without our written permission is prohibited.
We reserve the right to
immediately terminate the subscription of any TSI subscriber who
distributes the TSI commentaries without our written
permission.
Silver
versus Gold
...when confidence is falling there will generally be a flight toward money that should logically benefit the more monetary metal relative to the more industrial
one.
With the stock market having most likely commenced an intermediate-term correction it's a good time for us to go over some old ground; specifically, we are going to re-visit the relationship between the silver/gold ratio and the broad stock market that we've discussed a number of times over the past several years.
One of the most reliable relationships in the financial world since the early 1970s can be expressed as follows: silver outperforms gold when confidence in financial assets is rising and under-performs gold when confidence in financial assets is falling. This relationship can sometimes be obscured in real time by the silver/gold ratio's volatility, but is usually apparent in longer-term chart comparisons of the silver/gold ratio and the S&P500 Index. For example, the following chart shows that the silver/gold ratio and the S&P500 Index have moved in lock-step over the past seven years -- falling together from the second half of 2000 through to the first half of 2003 and rising together thereafter.
The correlation between the silver/gold ratio and the S&P500 hasn't always been as 'tight' as it has been during the most recent cycle; however, over the past 35 years silver/gold's longer-term trends can usually be linked to confidence in financial assets as mentioned above and as more fully described in the 31st May 2006 Interim Update.
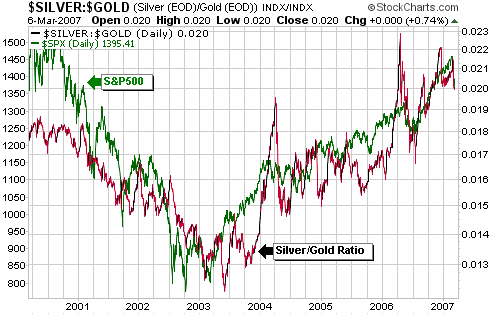
Silver has clearly outperformed gold since mid-2003, which is exactly what it should have done given that confidence has been in a powerful upward trend since that time. This upward trend in confidence is evidenced by the S&P500's cyclical bull market, but is perhaps even more readily apparent in the dramatic narrowing of spreads between the yields on high-risk and low-risk debt securities.
Further to the above, we don't think it makes sense to analyse silver's prospects relative to those of gold without taking into account the outlook for equities and economic growth. Along these lines, those who are very bullish on silver relative to gold and simultaneously very bearish on the US stock market really should explain why a relationship that has worked reasonably well for 35 years and appears to have become stronger over recent years is suddenly going to stop working.
From our perspective, there are two important considerations:
First, we are sympathetic to the argument eloquently put forward by Franklin Sanders
(The Moneychanger newsletter)
that silver's extensive industrial usage and much smaller market size will cause incremental increases in investment demand for precious metals to have a greater positive effect on the silver price than on the gold price. However, we can't ignore the empirical evidence indicating that silver will under-perform gold once the cyclical equity bull market of the past few years ends and the next cyclical bear market begins. Given that the stock market's current bull run is already an outlier in terms of duration, we are wary about making an investment choice whose success could depend upon a lengthy extension of the bull's life.
Second, gold's proven ability to out-perform silver when confidence is in a downward trend has a logical basis in that gold's price is almost totally driven by changes in investment demand whereas industrial demand is a very important factor in the silver market. In other words, when confidence is falling there will generally be a flight toward money that should logically benefit the more monetary metal relative to the more industrial one.
These considerations lead us to conclude that one of the following must happen for silver to out-perform gold over the next few years:
1. A quick end to the downturn that commenced in February followed by a resumption of the upward trend in global growth (and the associated upward trend in confidence) that began in 2003
2. A gain in the investment demand for silver during major (1-2 year) declines in equities and financial/economic confidence of sufficient size to not only offset a drop-off in silver's industrial usage, but to also offset the effect, on the gold price, of the increased investment demand for gold that would likely occur under such circumstances.
Cutting to the chase, we suspect that silver WILL out-perform gold over the remainder of the long-term precious metals bull market, mainly because the US is not the global growth engine it once was and the long-term outlook for non-US economic growth remains bullish. However, we continue to view it as much riskier than gold because there are more things that could go wrong with a silver investment than with a gold investment. We therefore continue to believe that gold-related exposure should have a significantly greater weighting than silver-related exposure in an investment portfolio.
The
Stock Market
Global financial crisis or just an equity market event?
...a financial meltdown won't be imminent as long as complacency prevails within the debt
market.
When discussing the performance of emerging market equities in the 28th February Interim Update, we wrote:
"How, then, could we tell the difference between a sharp pullback within an on-going upward trend and the first downward leg in a cyclical bear market?
The best way, we think, is to follow what's happening to emerging market bonds. A lot of 'dumb money' (the public's money) flows into and out of emerging market equities, causing big swings that often don't have longer-term significance. However, the trading of emerging market bonds tends to be dominated by the 'not-so-dumb money' (investment banks and hedge funds). Therefore, a sharp decline in emerging market equities not confirmed by a significant widening of emerging market credit spreads (spreads between the yields on emerging market bonds and US Government bonds) will be suspect."
We went on to show that the EMD/USB ratio (the ratio between the Emerging Markets Income Fund and the US Treasury Bond) had not yet signaled the start of a major downturn.
EMD/USB has been, and continues to be, a useful and convenient indicator of what's happening to spreads between emerging market bond yields and relatively low-risk US Treasury bond yields. However, the "JP Morgan Emerging Market Bond Index (EMBI) Global Spread" -- a weighted index of the yield spreads between the US$-denominated bonds issued by Emerging Market governments and equivalent US Government bonds -- is a more direct indicator of the same thing. And as illustrated by the following chart sourced from the excellent fullermoney.com web site, the EMBI Global Spread has fallen from 900 basis points in October of 2002 to below 200 basis points over the past 12 months and has experienced only a minor up-tick over the past couple of weeks. This, in turn, suggests that what we are seeing is an equity market event rather than the early days of a global financial crisis.
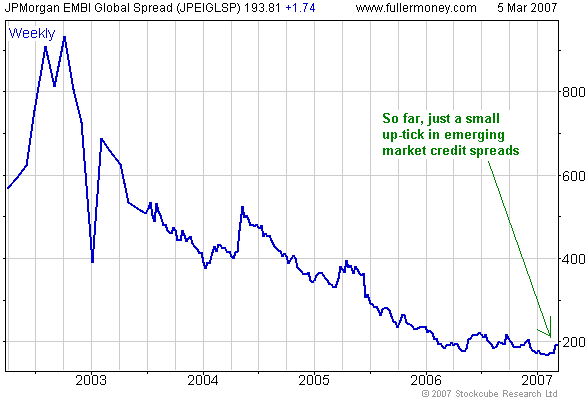
As things currently stand, the purchasers/holders of the US$-denominated bonds of countries such as Argentina, South Korea, Venezuela and Indonesia are prepared to accept an average premium of less than 2% over US Treasury bonds of equivalent duration. Actually, those who own the bonds of leading emerging market economies such as Brazil, Argentina and Mexico are obviously satisfied with a premium over US Treasury debt of less then 1% because that's the sort of yield premium at which these bonds are presently trading.
Putting this into perspective, US Treasury debt is essentially risk free in that the US Government can never run short of US dollars (the Fed stands ready, willing and able to purchase every dollar of US Government debt not purchased by someone else). Default happens surreptitiously via inflation, but under the current monetary system there is zero chance of the US Government directly defaulting on its debt. However, the emerging market governments that issue US$ debt (most internationally-traded emerging market debt is dollar-denominated) do not have the ability to create US dollars out of thin air, so the debt issued by these governments comes with the risk of direct default.
Therefore, the current situation is that 'investors' are pricing this direct default risk at less than 2% across the gamut of emerging market bond issuers and at less than 1% for the most stable emerging market bond issuers. This obviously signifies incredible complacency, but a financial meltdown won't be imminent as long as complacency prevails within the debt market.
Current Market Situation
In the latest Weekly Market Update we noted that the 10-day moving average of the CBOE put/call ratio had almost reached the all-time high set last May, indicating, in our opinion, an increase in fearfulness that was way out of proportion to the decline in price. Well, over the past three days this particular sentiment indicator moved above last year's extreme and set a new all-time high.
The extraordinarily quick pace with which stock market sentiment has changed suggests that the current downturn is not going to be a drawn-out affair. Prices could (probably will) drop well below the recent lows before anything more than a 'dead cat bounce' gets underway, but our guess is that an important bottom will be in place by the end of April.
We won't even hazard a guess at this time as to whether the decline from the February high to whatever low is reached over the coming several weeks will prove to be a correction within an on-going cyclical bull market or the first downward leg in a cyclical bear market. In either case, though, a multi-month recovery should follow the current decline.
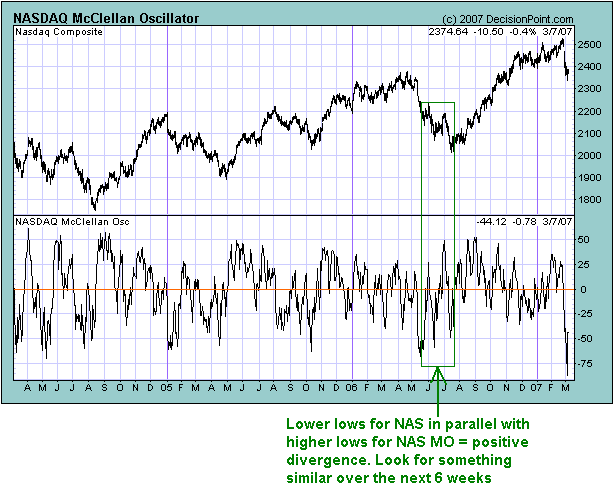
Something that has happened at most of the important stock market lows over the past several years is a positive divergence between the NASDAQ Composite Index and the NASDAQ's McClellan Oscillator (MO). What we are referring to is the tendency of the NASDAQ's MO to bottom ahead of the underlying index and to make one or more higher lows while the index continues to hit lower lows. Something to watch out for over the next 4-6 weeks, then, will be a new low in the NASDAQ that is not confirmed by a new low in the NASDAQ's MO.
Gold and the Dollar
Gold
...a falling stock market is not bullish for gold except to the extent that it leads to easier monetary policy and less confidence in the official
money...
Gold bulls have been disappointed, frustrated, and in some cases even infuriated by gold's performance over the past seven trading days, with the source of their discontentment being gold's decline in the face of what is, in their opinion, a very 'gold-bullish' backdrop. Their conclusion is that gold would have moved higher if not for the 'dark forces' that intervened to push it lower.
We have no idea if there have been concerted efforts by governments and banks to suppress the gold price over the past couple of weeks, but market manipulation is not the most logical explanation for the recent price action. History tells us that when the financial backdrop really is 'gold bullish' then the gold price rises regardless of officialdom's attempts to push it lower. The logical conclusion, therefore, is that the backdrop is not yet bullish enough.
The financial winds have certainly shifted in gold's direction of late, but these winds appear to be quite weak at this stage. In particular, a falling stock market is not bullish for gold except to the extent that it leads to easier monetary policy and less confidence in the official money; but although the stock market's swoon has prompted the debt market to price-in one additional 25 basis-point Fed rate cut there have, to date, been only minor increases in credit and yield spreads. As discussed earlier in today's report, the implication is that we are seeing an equity market correction rather than a broad-based financial/economic disruption. Things may well change over the coming weeks, but that's the general perception right now.
But why, then, would the gold price drop by almost 10% from its recent high to this week's low in parallel with the financial backdrop becoming slightly more positive for the monetary metal?
The main culprit, we think, is the surge in speculative long positions in the gold market during January and February. Specifically, between 9th January and 27th February the total (large + small) speculative net-long position in COMEX gold futures rocketed from 81000 contracts to 184000 contracts. In the gold market the speculators are invariably right in that they are invariably net-long during bull markets and net-short during bear markets, but at times their collective position becomes extreme and a counter-trend move ensues as profits are taken or stop-losses are hit. Unfortunately, we never really know in advance what constitutes an "extreme" position because there are no fixed benchmarks, but it's clear that speculators had piled into the gold market in anticipation of a very bullish outcome prior to the recent downturn. This left the market vulnerable to a sharp correction.
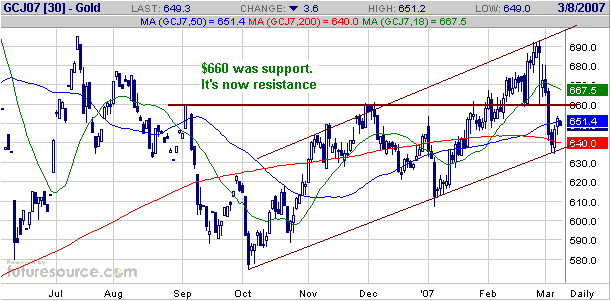
We were expecting a multi-week correction in the gold market to occur at around this time, but didn't expect it to be as steep as it is proving to be. Within the space of 5 days the April gold futures contract (see chart below) went from the top to the bottom of its price channel, something that took 5 weeks to accomplish during the preceding correction.
Former support at $660 will now be resistance and will probably cap the rebound that began on Tuesday.
Before gold can mount anything more than a counter-trend rebound it will probably be necessary for most of the weak-handed speculators that piled-in during the January-February rally to be shaken out of the market. We will be surprised if the current correction results in the speculative net-long position dropping as low as it did in early January, but a fall in this position to around 100,000 contracts might be required to set the scene for the next tradable advance.
Gold Stocks
The most likely scenario, in our opinion, continues to involve a March or April pullback low followed by a rally into
May.
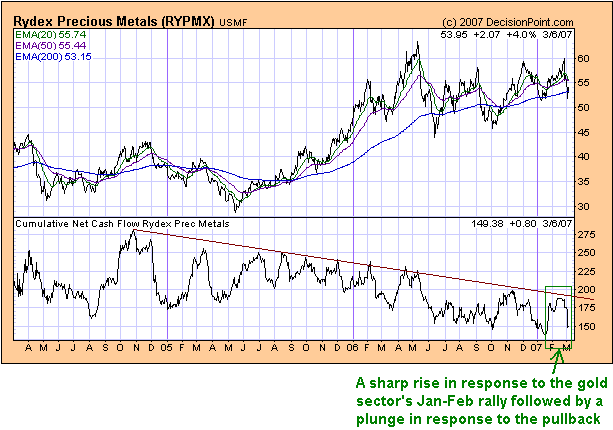
We noted in the 29th November 2006 Interim Update and in earlier commentaries that the November-2004 introduction of the gold bullion ETF (GLD) had probably reduced the amount of cash invested by the general public in gold stock mutual funds such as the Rydex Precious Metals Fund (Rydex PM). This is, we think, the main reason why the cumulative net cash flow into Rydex PM has been in a downward trend since the final quarter of 2004 (see chart below). Funds such as Rydex PM have undoubtedly also suffered due to competition from the silver ETF (SLV) and the gold stocks ETF (GDX), both of which came into being during the second quarter of last year.
But despite the shrinking size of Rydex PM, the cumulative cash flow into the fund still works reasonably well as an indicator of sentiment towards the gold sector. We just have to allow for the likelihood that the amount of invested cash will peak and trough at progressively lower levels. For example, the cumulative cash flow's drop to below US$150M in early January was a clear indication that the sentiment backdrop had become ripe for a gold stock rally, whereas the late-February move to around US$185M warned that sentiment had become optimistic enough to warrant a pullback.
As illustrated by the following chart, the downturn in the gold sector over the past seven trading days has already had the effect of taking Rydex PM's cumulative cash flow back to around $150M. If the pattern of declining highs and lows continues then the next bottom in the gold sector will probably occur soon after this particular sentiment indicator drops below its January low.
We currently have two nagging concerns with regard to the gold sector's performance, the first being the weakness in the major gold shares over the past three months relative to the junior gold shares -- the juniors haven't exactly been on fire, but there's been considerably more life at the small-cap end of the gold share universe than at the large-cap end -- and relative to gold bullion. These are things that usually only happen late in the game.
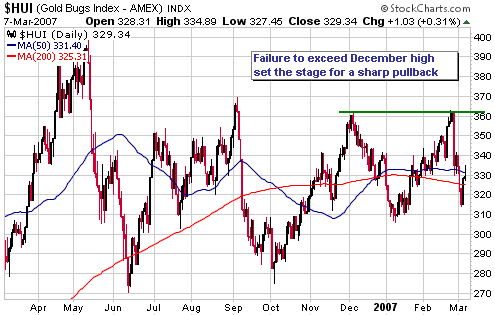
The second concern relates to the inability of gold stock indices such as the HUI (see chart below) to exceed their December highs during the January-February advance.
The most likely scenario, in our opinion, continues to involve a March or April pullback low followed by a rally into May. As a result, we expect the next short-term profit-taking opportunity to emerge in May. However, in light of the above-mentioned concerns we think it would be prudent, for risk management purposes, for those who have not yet built up a sizeable cash reserve to raise some cash during strength over the coming week or so.
Update
on Stock Selections
(Note: To review the complete list of current TSI
stock selections, logon at http://www.speculative-investor.com/new/market_logon.asp
and then click on "Stock Selections" in the menu. When at the Stock
Selections page, click on a stock's symbol to bring-up an archive of
our comments on the stock in
question)
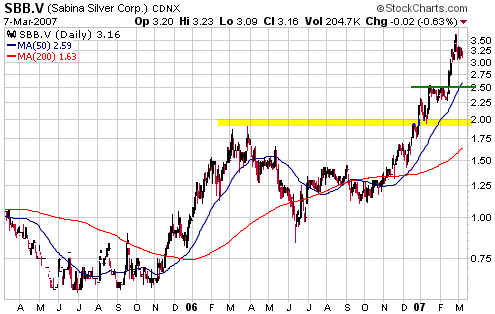
 Sabina Silver (TSXV: SBB). Recent price: C$3.16 Sabina Silver (TSXV: SBB). Recent price: C$3.16
Early this week SBB released the results of the initial economic assessment for its Hackett River zinc/silver project. According to the assessment done by an independent engineering firm (Wardrop), a "base case" discounted cash flow analysis of the Hackett River project reveals a pretax net present value (NPV) of $345-million at an 8% discount rate with a pre-tax internal rate of return (IRR) of 20.6%. This base case assumes prices of US$0.72/pound for zinc and US$8.69/ounce for silver. At current metal prices the NPV and IRR rise to $2.6B and 77%, respectively.
These are significant numbers for a company with a market capitalisation of only C$190M.
The capital cost of $527M is way too high for a small company like SBB to fund, but this is unlikely to be an issue because SBB will probably end up being purchased by a large- or mid-size mining company before a construction decision is made.
In our opinion, SBB is in a similar situation today to where Western Silver was four years ago (Glamis Gold bought Western Silver in early 2006). In particular, it has its hands on a big metal deposit that will almost certainly get much bigger with additional exploration and will almost certainly be of interest to a larger mining company following the completion of a bankable feasibility study. Ideally, though, a takeover won't come until after the stock price has moved to a multiple of its current level.
With reference to the following chart, the optimum place to buy SBB would be near intermediate-term support at C$2.00. However, we doubt that the stock will trade that low again unless the downturn in the resource sector becomes far more substantial than we currently envisage. A more realistic buy zone would be near short-term support in the C$2.50s.
Mawson Resources (TSXV: MAW). Recent price: C$2.84
As a general rule, volatility doesn't bother us at all. In fact, it's our investment lifeblood in that it periodically provides us with opportunities to buy $1 of value for much less than $1 and to sell $1 of value for more than $1. There is, however, a situation in which high volatility makes us uncomfortable: the situation where we aren't confident regarding the value of a stock. This is the situation we find ourselves in now with
regard to exploration-stage uranium miner Mawson Resources (TSXV: MAW).
When we added MAW to the TSI Stocks List it had a market capitalisation of only C$30M, which meant that the market was valuing the company's uranium projects at almost nothing. We didn't know what these projects were worth, but we were pretty sure they were worth something and that the market's valuation would increase substantially if the general level of speculation increased within the uranium sector.
Since being added to the TSI Stocks List MAW's market capitalisation has risen to around C$110M due to a combination of share price appreciation and the issuing of new equity. This is still a fairly low market cap for a company with MAW's potential, but the downside risk is now greater than it was and the company's exploration work hasn't yet progressed far enough for us to be able to quantify the underlying value.
Given our uncertainty regarding the company's underlying value, the uncertainty associated with the development of uranium projects in Sweden (although the political situation will probably change, uranium mining is currently banned in Sweden), and the possibility that a general market-wide shift away from risk is in its early stages, we have decided to exit MAW. The profit on the trade, based on Wednesday's closing price of C$2.84 and our April-2006 entry price of C$1.16, is 145%.
Thunder Energy (TSX: THY.UN). Recent price: C$3.75
THY.UN, an income trust that produces natural gas and oil, took a hit in the stock market earlier this week due to a downward revision to its reserves and a lowering of its 2007 production forecast.
The trust is now selling at a 30% discount to its net asset value (NAV), a discount that quite likely reflects some irrational fear as well as some rational dissatisfaction with the company's management and operational performance. The large discount to NAV creates a margin of safety, but we wouldn't be averaging down aggressively if we already had a significant position in THY. We think it would, however, make sense for investors who currently don't have a position in THY to do some buying near the current price.
Chart
Sources
Charts appearing in today's
commentary are courtesy of:
http://stockcharts.com/index.html
http://www.futuresource.com/
http://www.fullermoney.com/

|