|
- Interim Update 7th March 2012
Copyright
Reminder
The commentaries that appear at TSI
may not be distributed, in full or in part, without our written permission.
In particular, please note that the posting of extracts from TSI commentaries
at other web sites or providing links to TSI commentaries at other web
sites (for example, at discussion boards) without our written permission
is prohibited.
We reserve the right to immediately
terminate the subscription of any TSI subscriber who distributes the TSI
commentaries without our written permission.
Oil Update
The Big Picture
In inflation-adjusted (IA) terms, the US$ oil price is currently near the middle of its 40-year range and is down by almost 50% from its 2008 peak. The situation is illustrated below. Note that "inflation-adjusted" in this case means adjusted for changes in US currency supply, population and productivity, as opposed to adjusted for changes in some bogus number called CPI or PPI.
At today's level oil therefore appears to be neither expensive nor cheap in real terms. In current dollar terms it would have to rise to around $200/barrel to exceed its 2008 peak.
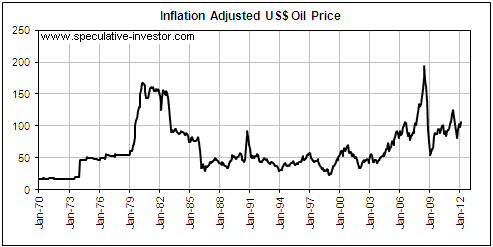
What are the chances of oil challenging its 2008 peak in inflation-adjusted terms?
The odds are against it. In real terms the 2008 peak will probably turn out to be the secular
variety, because oil, at that time, was extremely expensive relative to almost everything. Oil's valuation in mid 2008 was at the sort of level that is usually only seen near the top of a major bubble.
In our opinion, only a huge supply shock stemming from war in the Middle East could push oil back to its 2008 peak in real terms. Unfortunately, such a shock has a realistic chance of happening in 2012. It's not the most likely scenario, but its probability is high enough to warrant serious consideration.
The war we are primarily concerned about would involve Iran and the U.S. Iran would have nothing to gain and a lot to lose from military conflict with the US, so it is very unlikely that Iran would initiate such a conflict. The problem is that factions within the US government appear to be 'hell bent' on manufacturing circumstances that naturally lead to war.
The risk is that the US government will continue to goad its Iranian counterpart until the Iranians become militarily aggressive. This risk will increase if the trends in US economic numbers turn for the worse over the months ahead, because a distant war could divert attention from problems at home and provide an excuse for additional money pumping.
Another consideration is that while a war pitting Iran against the US and/or Israel would probably be required to get the oil price to a new all-time high in real terms, a return to the 2008 nominal high of around US$150 could occur on the back of conflict in the Middle East between the two major branches of Islam (Sunni and Shia) or the continuation of the wave of protests and revolutions known as the "Arab Spring". To put it simply, there is presently a lot of potential for oil-price-boosting political instability in the Middle East.
Current Market Situation
The oil price has been 'correcting' since late February. This pullback is a normal reaction to the near-vertical advance that took place during the first three weeks of February.
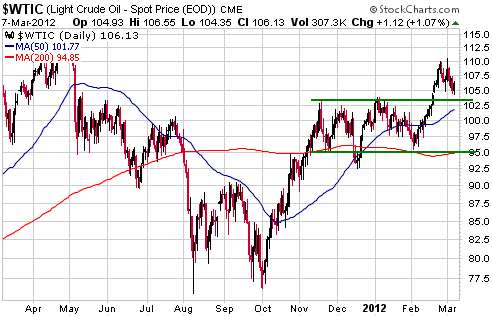
The following daily chart shows that West Texas Intermediate Crude has support at $103 and then at $95. It's possible that the market will do no worse that decline to the higher of these support levels before a rally to new multi-month highs gets underway, but the lower support level defines the short-term downside risk.
 The Stock Market
The senior US stock indices peaked only a few days ago, but the overall market is already 'oversold' on a short-term basis. This set of circumstances has arisen because although the high-profile stock averages have only just peaked, the average stock peaked in early February and has been in 'correction mode' for the past 5 weeks.
The recent divergence between the stock averages and the average stock explains the rather strange situation depicted by the following chart. The top section of the chart shows that the NASDAQ Composite Index has just pulled back a little after hitting a multi-year high last week, while the bottom section of the chart shows that the NASDAQ's McClellan Oscillator (MO) hit an 'oversold' extreme on Tuesday.
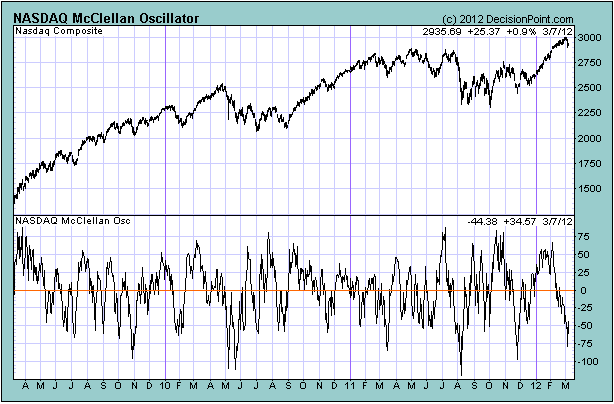
In the latest Weekly Update we said that we might upgrade our short-term stock market outlook to "neutral" if a pullback over the ensuing two weeks pushed the NASDAQ's MO below -75. The NASDAQ's MO was -78 at the close of trading on Tuesday, but we have decided to maintain our "bearish" stance for now. The short-term downside risk is limited by the extent to which the overall market is 'oversold', but it still outweighs the short-term upside potential.
Gold and the Dollar
Gold and Silver
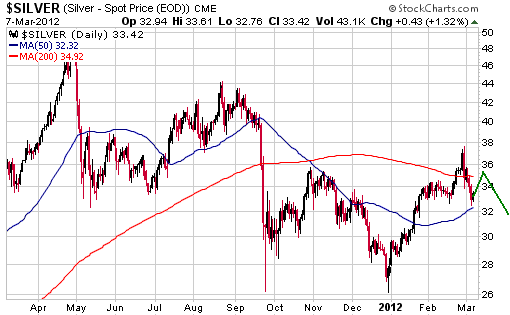
On Tuesday 6th March, gold and silver billion dropped back to near the most likely levels for short-term correction lows (the $1650s for gold and $32 for silver). They have since begun to rebound.
There's a chance that correction lows are now in place, but it's more likely that Tuesday's lows marked the end of the first leg down and that there will be another leg down once the current rebounds have run their course. The green lines drawn on the following daily silver chart represent our best guess as to how the price pattern will unfold over the weeks ahead for both gold and silver.
Regardless of whether or not a pullback low is already in place, the short-term corrections in gold and silver will probably end this month. The reason is that sentiment measures have already tumbled to levels that reflect minimal enthusiasm. To put it another way, there are indications that most weak-handed 'longs' have already been washed out of the market.
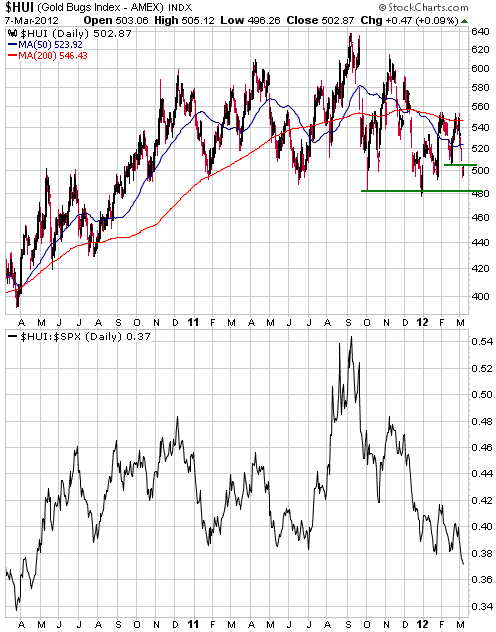
Gold Stocks
The top section of the following daily chart shows that the HUI has breached short-term support at 505. Consequently, it could be heading for a test of intermediate-term support at 480. We will be surprised if support at 480 is breached on a daily closing basis anytime soon, but be aware that there is a small chance of getting what traders sometimes refer to as a "whoosh" -- a final cleansing shakeout prior to an upward reversal.
The bottom section of the following chart shows that the HUI/SPX ratio just fell to its lowest level in almost two years. This means that the gold sector is now very 'oversold' relative to the broad market, which REDUCES the risk of additional relative weakness in the gold stocks.
Currency Market Update
The Greek government's debt default (the story that never dies) is still grabbing a lot of headline space. The financial world's immediate focus is on whether or not there will be sufficient voluntary private-sector participation in the planned debt swap to avoid the need to invoke "Collective Action Clauses (CACs)". If the CACs were invoked then as far as we can tell it would no longer be possible to classify the private sector's involvement as voluntary, meaning that the Greek government's default would have to be officially called a default and the sellers of credit insurance (Credit Default Swaps) would have to pay up.
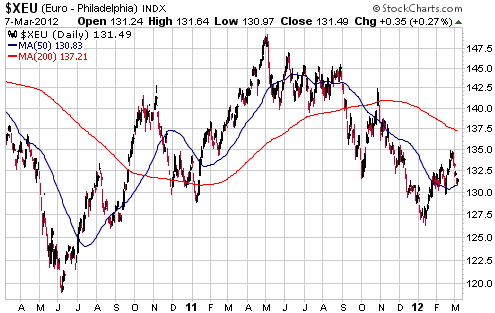
If the Greek government's default became official, the situation would become messier. The euro would probably weaken, although we doubt that news related to the Greek government's financial travails -- whatever the news happened to be -- would have the potential to push the euro below its January-2012 bottom. We expect the euro to eventually trade well below its January-2012 low, but "eventually" here means no earlier than the second half of this year. A euro decline of this magnitude would likely be part of a general flight to safety that would also encompass a large stock market decline.
Currently, the euro is in a similar position to gold and silver. While sentiment indicators suggest that it isn't far from a short-term correction low, it could drop a bit further before this month is out.
Update
on Stock Selections
Notes: 1) To review the complete list of current TSI stock selections, logon at
http://www.speculative-investor.com/new/market_logon.asp
and then click on "Stock Selections" in the menu. When at the Stock
Selections page, click on a stock's symbol to bring-up an archive of
our comments on the stock in question. 2) The Small Stock Watch List is
located at http://www.speculative-investor.com/new/smallstockwatch.html
 Volta Resources (TSX: VTR). Recent price: C$1.37 Volta Resources (TSX: VTR). Recent price: C$1.37
In the 15th February Interim Update we wrote that a pullback to the mid-C$1.20s would create a new opportunity to buy VTR shares. We doubted that it would drop that far, but thanks to a very weak market environment it traded as low as C$1.18 on Tuesday 6th March before rebounding.
In the above-mentioned commentary we also wrote that for TSI record purposes we would exit VTR if it traded at C$1.90. This no longer applies. Due to recent price action and press releases the stock appears to have greater short-term upside potential than we previously thought, so we are raising our target exit price to C$2.10.
Important news in the form of a preliminary economic analysis and an updated resource estimate for VTR's Kiaka gold project is expected within the next few weeks.
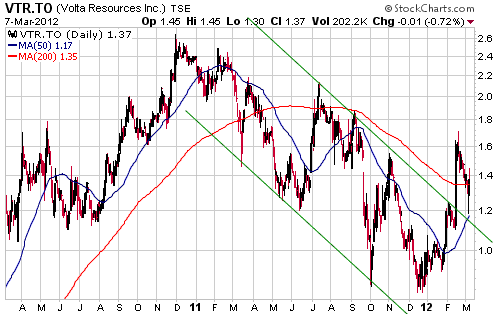
Note that we still view the mid C$1.20s as a 'buy zone' for VTR shares.
Sabina Gold and Silver (TSX: SBB). Shares: 161M issued, 170M fully diluted. Recent price: C$3.07
In the latest Weekly Update we wrote:
"[SBB] has obviously been weaker than we expected, for -- as far as we can tell -- no reason other than sentiment. The negative sentiment is at least partly due to difficulties being experienced by other mining companies with projects in the same region."
The "other mining companies with projects in the same region" to which we were referring are Newmont Mining and Agnico Eagle. As discussed in the 13th February Weekly Update, Newmont made it known in late January that it was slowing the development of its Hope Bay project in Nunavut. From an SBB sentiment perspective, this was probably the most significant news. Sentiment towards Nunavut-based projects subsequently took another hit due to Agnico Eagle's admission that the performance of its Meadowbank project was worse than planned.
SBB's management attempted to address the aforementioned sentiment issue in its 5th March press release. Here is the relevant excerpt from the press release:
"Working in the Canadian North
The last few weeks of Sabina trading has seen some significant pressure on the company's share price. In its view, this seems to be the culmination of negative market sentiment regarding two Arctic projects that have been experiencing challenges with their operations.
Agnico-Eagle's Meadowbank gold mine has experienced higher-than-expected operating costs resulting in targets not being met and reductions in grade and mine life (see Agnico press release dated Feb. 15, 2012). Despite Agnico's issues at the Meadowbank mine, its higher-grade Meliadine project, also located in Nunavut, continues to grow and meet permitting targets (see Agnico press releases dated Feb. 15 and Feb. 21, 2012).
Newmont Mining also recently announced that it was putting its Hope Bay gold project in Nunavut on care and maintenance.
Without minimizing the costs and challenges of operating in such a remote location, the company believes there are clear differences between Back River and these other projects.
"There is no question that the Arctic environment is challenging, however, it is no more so than working in any other remote region in the world that lacks infrastructure and power," said Mr. Pease. "What is clear is that successful projects need to have sufficient grade, width, continuity and mineability to support the project requirements and infrastructure. Back River's grade is significantly higher than that of Meadowbank or Hope Bay. High grade combined with mining widths which average approximately 25 metres and shallow-plunging deposits at the Goose claim block provide the foundation for what we believe will be a successful mining operation at Back River.""
There has also been substantial selling of SBB shares by Dundee Corp., an institution with a large (>10%) stake in SBB. We mentioned this in our 13th February report.
Dundee's selling has added to the downward pressure on SBB, but it doesn't appear to be the most important factor. We say this because the market was comfortably absorbing the Dundee selling until sentiment took a turn for the worse at the end of January in reaction to the Newmont news and a market-wide shift away from speculative stocks. As evidence we point out that on a net basis Dundee sold about 4.4M shares from early December through to late January. a period during which the price of SBB shares rose about 10%, and sold about 1.8M shares from late January through to 1st March, a period during which the price of SBB shares fell by about 28%.
In our experience, institutional shareholders tend to be fickle and generally shouldn't be considered 'smart money'.
Buying Opportunities
In addition to the ones mentioned above, here are some gold stocks that are good candidates for new buying at this time:
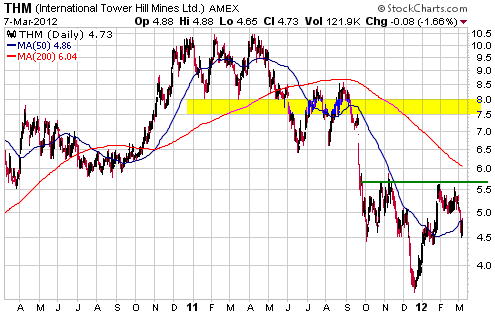
1. International Tower Hill Mines (THM).
THM tested resistance at US$5.70 at the end of January and has since pulled back to support. It appears to be tracing out the "right shoulder" of a "head and shoulders" bottom. We don't place a lot of emphasis on these popular chart patterns, but the chart pattern meshes with our understanding of the stock's fundamentals.
Resistance at $7.50-$8.00 would be the measured objective following a solid break above $5.70.
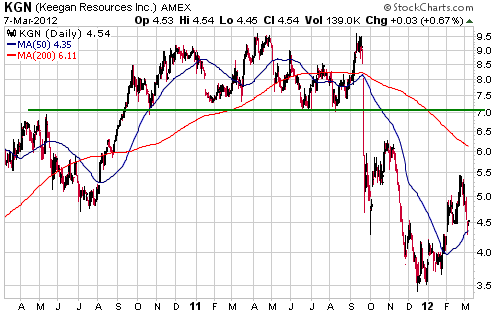
2. Keegan Resources (KGN)
KGN's initial rally from its December-2011 bottom peaked late last month at US$5.50. The stock has since pulled back to its 50-day moving average in the US$4.30s.
The next rally will probably take KGN up to at least the low-US$6 area and will possibly take it as high as resistance at $7.00.
3. Of our Australia-listed gold stocks, Dragon Mining (ASX: DRA) and Endeavour Mining (ASX: EDR, TSX: EDV) are the best candidates for new buying at current prices.
Chart Sources
Charts appearing in today's commentary
are courtesy of:
http://stockcharts.com/index.html
http://www.decisionpoint.com/

|
