|
- Interim Update 7th May 2003
The US
Stock Market
Don't worry, be happy
Over the past year, two of the most
powerful trends in the financial markets have been the downward trend in
the US$ and the upward trend in the bond market. It seems to make sense,
therefore, to conclude that when things really do start to get better we
will see a change in at least one these trends, that is, we will see the
dollar start to strengthen and/or bonds start to weaken. As discussed in
last week's Interim Update, one way to determine if this is happening is
to look at the bond/dollar ratio (the price of a 30-year Treasury Bond
divided by the Dollar Index).
Last week we included a chart of the
bond/dollar ratio to highlight what we consider to be an important non-confirmation
of the stock market's rally. In a nutshell, the powerful up-trend in the
bond/dollar ratio caused by a strengthening bond market combined with a
weakening US$ was showing no signs of abating. In fact, the ratio appeared
to be headed for a new high. This was, in our opinion, one piece of evidence
that the stock market's rally was based far more on hope than on any genuine
improvement in the fundamentals.
We'll now take another look at the
relative performances of bonds and the US$, this time over a longer period
of time and using the dollar/bond ratio as opposed to the bond/dollar ratio.
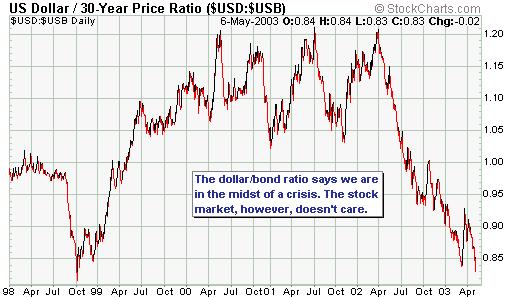
There are two points we want to make
with respect to the below chart of the dollar/bond ratio (note, by the
way, the line on the chart rises when the US$ is rising relative to US
bonds). First, as if in mockery of the 'feel good' rally that has occurred
in the stock market, the dollar/bond ratio has just sunk to a new low for
the year. This is a glaring divergence - either the currency and bond markets
are completely wrong or the stock market is wrong. Second, the dollar/bond
ratio has just moved down to near the level that was reached during the
height of the August-October 1998 financial crisis (when the Asian currency/debt
crisis, a Russian debt default and the failure of a massive hedge fund
combined to almost bring down the house of cards known as the world's financial
system). At that time, fear was rampant in the stock market (the VIX was
above 50 and 48% of the newsletter writers surveyed by Investors' Intelligence
were bearish) and stock prices were plunging. Now we have a similar extreme
in the dollar/bond ratio, once again indicating a crisis, but this time
stock-market participants couldn't be more complacent (the VIX is around
23 and only 24% of newsletter writers are bearish).
When the crisis dissipated in 1998
the dollar/bond ratio moved sharply higher, as did the stock market. Note,
though, that the stock market wasn't able to begin its recovery in 1998
until the dollar/bond ratio turned higher. As long as the dollar/bond ratio
was falling the stock market remained under immense pressure. Today, however,
the things that are causing the crisis (economic weakness in most of the
major economies and the massive US current account deficit) obviously aren't
perceived to be big problems for stock market. That, however, will change.
Another non-confirmation of the
bulls' case
While we are on the subject of non-confirmations,
lets take a look at a chart of the A$ in terms of the euro (the below chart
shows the number of euros per Australian Dollar, so the line on the chart
rises when the A$ is rising relative to the euro). Over the past few years
the A$ has out-performed the euro during periods of stock market strength
and under-performed during periods of stock market weakness. For example,
the important stock market peaks in September-2000, May-2001 and March-2002
(identified by the down arrows on the below chart) corresponded very closely
with peaks in the euro/A$ exchange rate while the important bottoms in
April-2001 and September-2001 (identified by the up arrows on the below
chart) corresponded almost exactly with troughs in the euro/A$ exchange
rate. Also, huge rallies in the A$, relative to the euro, followed the
intermediate-term bottoms in the stock market that occurred in April and
September of 2001. However, there clearly hasn't been anything similar
over the past 9 months (the shaded area on the chart). In fact, the chart
of the euro/A$ rate reveals the same sideways trading since last July as
the chart of the S&P500 Index.
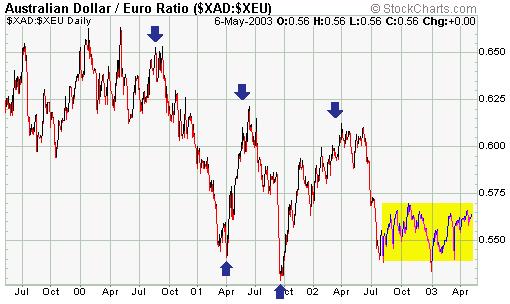
The above chart is actually consistent
with the generally sideways action in the stock market, but it is inconsistent
with the prevailing stock market sentiment.
Current Market Situation
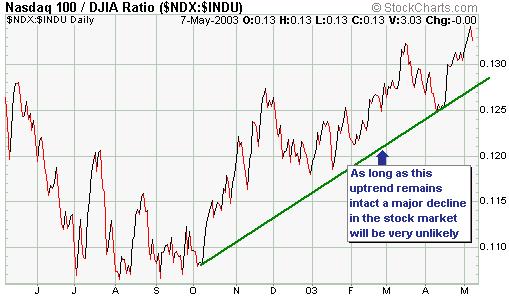
Below is a chart showing the NDX/Dow
ratio (the NASDAQ100 Index divided by the Dow Industrials Index). The uptrend
in the NDX/Dow ratio is one of several signs that investors have become
less risk averse over the past several months (the NASDAQ100 stocks are
generally considered to be more risky than the Dow stocks). Furthermore,
the early and middle stages of all the major declines over the past 3 years
have been characterised by weakness in the NDX relative to the Dow. Therefore,
and as discussed on many occasions since late February this year, as long
as the uptrend shown on this chart remains intact we shouldn't get excited
about the prospect of another major decline in the stock market (a drop
in the stock indices to well below last October's lows).
Further to the above, a decline in
the stock market over the next few weeks that does NOT result in a break
of the uptrend in the NDX/Dow ratio is probably going to create a buying
opportunity for short-term traders. Note: Given how bullish most traders
currently are, a pullback has a very high probability of occurring over
the next 1-2 weeks.
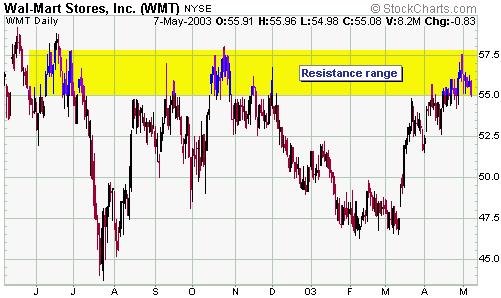
Several weeks ago we mentioned that
the stock price of the world's largest company (Walmart) had been a reasonable
leading indicator for the overall market over the past year or so because
it had peaked and troughed in advance of the S&P500 Index. We also
mentioned that a new recovery high in the S&P500 Index that was not
confirmed by a new recovery high in the Walmart stock price would be a
sign of trouble for the market.
Interestingly, this week's new high
for the S&P500 Index was not confirmed by a new high for WMT. As the
following chart shows, WMT peaked at the end of April in the midst of a
resistance range. It is too early to know whether this non-confirmation
of the recent new high in the S&P500 is important because WMT might
just be pulling back in preparation for another rally. However, the significance
of this non-confirmation would increase if WMT now closes below its April
low ($51.50).
Bond market
Update
The below chart of June bond futures
shows that bonds made a new high for the year on Wednesday. This is surprising,
to say the least, considering that the stock market had moved to a new
recovery high just one day earlier.
We can come up with three possible
explanations for the recent strength in the bond market. They are:
a) The inverse relationship between
stocks and bonds that has dominated the financial landscape since 1998
is no longer in effect and bonds have begun to respond to economic fundamentals.
b) The Fed is surreptitiously following
through on its threat to cap long-term interest rates at an artificially
low level by buying bonds.
c) A huge divergence is building and
this divergence will be resolved, in the near future, by a sharp drop in
stock prices OR a sharp drop in bond prices.
Of the above, explanation a) is the
least likely. In the absence of a panic that pushes money towards the lowest-risk
investments it is extremely unlikely that US bonds would remain strong
in the face of such a weak US$. We are clearly NOT in the midst of a panic
at this time. In fact, as we've pointed out many times over the past 2
months there are definite signs that investors are becoming less risk averse,
not more risk averse. We would take explanation a) more seriously, though,
if at some stage we witnessed just one trading day during which both stocks
and bonds dropped sharply.
Explanation b) has the advantage of
explaining how US bonds could be so strong in parallel with both a plummeting
US$ and a rising US stock market since any effort by the Fed to cap long-term
rates would encourage foreign investors to exit dollar-denominated debt.
If this explanation is the correct one then the dollar will remain very
weak, bonds will remain surprisingly strong and the stock market will not
plummet in the short-term. Also, the gold price should soon start to show
considerable strength because it is the one currency that central banks
can't create out of thin air and, therefore, can't devalue at will.
At this stage we think explanation
c) is the most likely. However, if the market believes the Fed is
capping long-term interest rates by buying bonds, or that it will do so
in the future, then this belief will certainly be contributing to the bond
market's rally.
Gold and
the Dollar
Currency Update
Since early last month our expectation
has been that the Dollar Index would bottom in the 95-96 range during May.
We are obviously now in May and the Dollar has fallen to the 95-96 range,
so this is not the time to be aggressively bearish on the dollar as far
as the short-term is concerned. However, as discussed in the latest Weekly
Update a near-term spike below 95 is a definite possibility. In fact, a
drop down to our long-standing target of 90 would be technically perfect
and would set the stage for a substantial counter-trend rally.
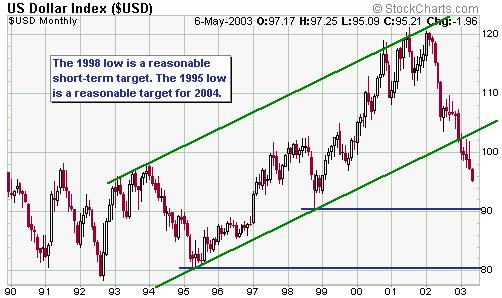
The below monthly chart of the Dollar
Index shows the break of the long-term uptrend that occurred during the
final quarter of last year as well as the major support corresponding to
the 1998 and 1995 lows. In our opinion the US$ would be a strong BUY in
the 90-92 range in anticipation of a multi-month counter-trend rally.
However, the term 'counter-trend' must be emphasised because last year's
break below the major upward-sloping channel projects an eventual decline
to the 1995 low.
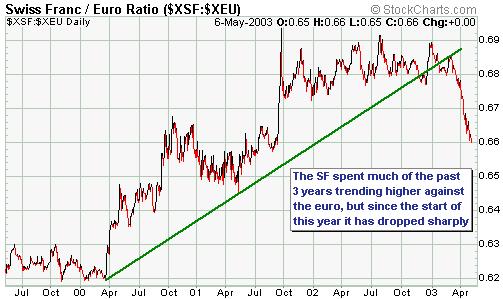
Gold doesn't move inversely to the
US$ so much as it moves in the same direction as the Swiss Franc (gold's
positive correlation with the SF is much stronger than its negative correlation
with the Dollar Index). For this reason we spend more time looking at charts
of the SF than at charts of any other currency. Interestingly, the sharp
decline in the gold price in terms of the euro over the past few months
has been mirrored by a sharp decline in the SF relative to the euro.
What appears to have happened since
the beginning of this year is that the relatively weaker currencies have
made catch-up moves against the currencies that had previously been relatively
stronger. For example, coming into this year gold and the SF were the two
strongest currencies while the C$ was one of the weakest, but since the
start of this year we've seen the euro and the A$ make up some ground against
gold and the SF while the C$ has made up ground against almost all other
currencies.
Gold Stocks
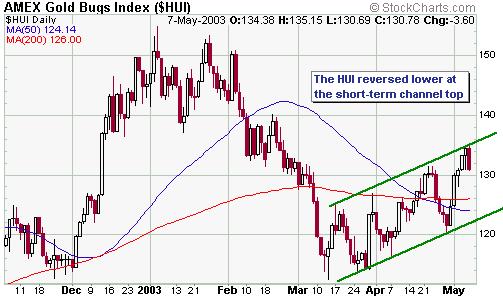
From the latest Weekly Update: "Two
weeks ago it looked like gold stocks were in the early stages of a rally
that would take the HUI to a new high over the next few months. However,
although gold stocks recovered nicely during the second half of last week
the entire rally since the 13th March low is starting to look more like
a rebound within a continuing downtrend than a new uptrend. This view would
be reinforced if the HUI turns lower from at or below the top of the channel
shown on the below chart. And a move below the bottom of the channel would
strongly suggest that the 13th March low was not the final low for the
correction that began in January."
As the following chart shows, the HUI
hit its short-term channel top on both Tuesday and Wednesday before reversing
lower. This, in turn, improves the chances that the rally since 13th March
has been a counter-trend move and not the initial stage of a new uptrend
as previously suspected.
As discussed in the Weekly Update,
we do not think that a drop below the 13th March low would have long-term
bearish implications for gold stocks. In fact, a pullback to around the
105 level in the HUI over the next few months would potentially be far
more bullish, as far as the next 1-2 years are concerned, than would a
near-term surge above the May-2002 and January-2003 peaks.
Note that the possibility of
a drop below the 13th March low won't become a high probability
until after the HUI moves below the bottom of the channel shown on the
above chart, but if you feel over-committed to gold stocks then it is better
to get your house in order while prices are higher than to wait for confirmation
of the short-term bearish case. By the way, as previously mentioned we
don't plan to do any significant selling of junior gold stocks in our own
account. We have purchased these stocks in anticipation of MUCH higher
prices over the next 2 years and would welcome another opportunity to add
to existing holdings over the next few months. However, in order to be
comfortable enough to ride-out the periodic gut-wrenching declines in these
stocks you need to fully understand the big picture and you must have plenty
of cash in reserve.
Gold and Silver
The gold price has moved quietly higher
in 'stair step' fashion since bottoming in early April (see daily chart
of June gold futures below). It jumped above its 50-day moving average
last week and has subsequently consolidated within a narrow range around
$342. A breakout from this range will very likely occur within the next
3 trading days.
So far gold has done nothing to negate
our forecast for a move up to around $360 within the next few weeks, although
given the price action in gold stocks and the likelihood that the US$ is
close to an important low we don't think this is a great time to be buying
gold for a short-term trade.
In the latest Weekly Update we noted
that silver had moved up to resistance in the 4.80-4.90 range and said
"...if
the recent rally is going to fail then now is a likely time for it to do
so. As is the case with the Yen, there is little to be gained by trying
to anticipate an upside breakout in the silver price because the move following
a breakout will be substantial in terms of both time and price." There
is nothing to add at this stage except to note that the silver price did
turn lower once it hit resistance at 4.80. In general, the worst time to
be bullish on anything is following a sharp rally up to, but not through,
important resistance.
Update
on Stock Selections
 Newmont
Mining (NYSE: NEM, ASX: NEM) has not been one of our favourite gold mining
companies over the past few years. However, as a result of the company's
good operational performance during the 4th quarter of last year, the substantial
shrinkage in the size of its hedge book late last year and early this year,
and the ability of the stock price to hold above important support during
the January-March pullback in the gold sector, our opinion changed during
the second half of March. If fact, we recommended NEM in the 24.50-25.00
range for anyone wanting exposure to major gold stocks. Newmont
Mining (NYSE: NEM, ASX: NEM) has not been one of our favourite gold mining
companies over the past few years. However, as a result of the company's
good operational performance during the 4th quarter of last year, the substantial
shrinkage in the size of its hedge book late last year and early this year,
and the ability of the stock price to hold above important support during
the January-March pullback in the gold sector, our opinion changed during
the second half of March. If fact, we recommended NEM in the 24.50-25.00
range for anyone wanting exposure to major gold stocks.
NEM's latest quarterly report, which
was released yesterday, has increased our bullishness. NEM is clearly now
a very well run company that offers good exposure to the spot gold price.
Furthermore, unlike some of the other high-profile North American gold
producers NEM is reasonable value at its current price.
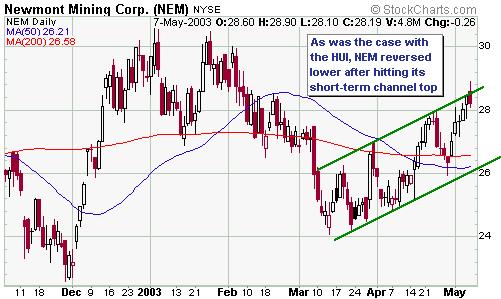
As a long-term investment NEM looks
attractive at its current price. However, from a short-term technical perspective
the outlook is not particularly bullish. As the following chart shows,
NEM has just reversed lower from near its channel top. For this reason
we are going to take a small profit now on the NEM January-2004 $30 call
options added to the TSI Stocks List in early April. We'll look for an
opportunity to purchase some January-2005 NEM call options over the coming
months.
Lucent
(NYSE: LU) has broken decisively above important resistance at $2.00, projecting
a move up to $3.00-$3.50 over the next few months. Note, though, that a
pullback to around $2 to 'test' the breakout would not be surprising before
the next rally phase gets underway. We'll increase our sell-stop to $1.79.
American
Bonanza (TSXV: BZA) released excellent drill results on Tuesday. If we
have time we'll provide some details on these results in the next Weekly
Update.
One of the things that interests us
about high-potential juniors such as BZA is that their stock prices are
not totally dependant on the gold price in that good drill results can
cause the prices of these stocks to rise even when the gold price is trending
lower. As such, they are generally not stocks that should be traded based
solely on a view of the gold price.
Copyright
Reminder
The commentaries that appear at TSI
are copyrighted material and may not be distributed, in full or in part,
without our written permission. In particular, please note that the posting
of extracts from TSI commentary at other web sites (for example, at discussion
boards) without our written permission is a breach of copyright.
Chart Sources
Charts appearing in today's commentary
are courtesy of:
http://stockcharts.com/index.html
http://www.futuresource.com/

|
