|
- Interim Update
7th May 2014, Parts 1 and 2 Copyright
Reminder
The commentaries that appear at TSI
may not be distributed, in full or in part, without our written permission.
In particular, please note that the posting of extracts from TSI commentaries
at other web sites or providing links to TSI commentaries at other web
sites (for example, at discussion boards) without our written permission
is prohibited.
We reserve the right to immediately
terminate the subscription of any TSI subscriber who distributes the TSI
commentaries without our written permission.
The
relentless decline in euro-zone (EZ) interest rates
One of the most extraordinary
happenings in the financial world over the past 12 months has been
the relentless decline in the yields on the bonds issued by some of
the most financially-stressed EZ governments. Furthermore, since the
beginning of this year the decline has had almost no interruptions.
This has led to the yields on the 10-year bonds issued by the
governments of Spain, Italy and Portugal (charts displayed below)
not only becoming very low compared to where they were a couple of
years ago, but also becoming very low in absolute terms. We note, in
particular, that the 10-year government bonds of Spain and Italy are
now yielding only 3%.
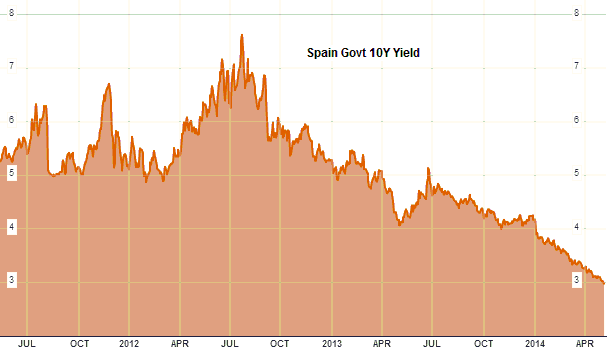
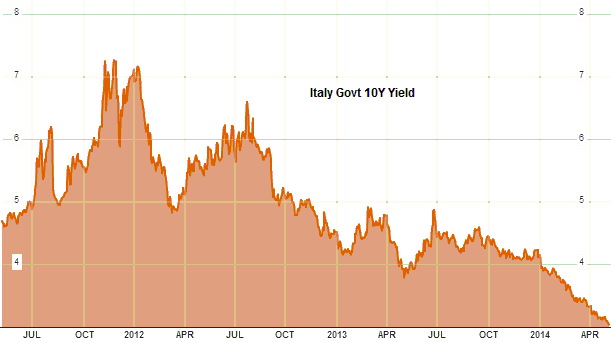
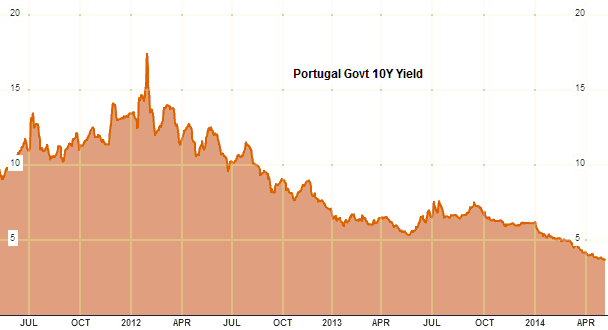
The situation depicted above is just one of the extremes being caused by the
central bank manipulation of money and credit. In effect, 'investors' are being
pushed to take a lot of risk to obtain a small reward. This will obviously end
badly.
Uranium
Update
After spending many months oscillating between
$34/pound and $36/pound, the uranium price plunged over the past few weeks and
is now in the high-$20s. This recent plunge in the uranium price transformed a
decline in the Uranium Mining ETF (URA) from what was shaping up to be a fairly
normal correction to the 200-day MA into a rout.
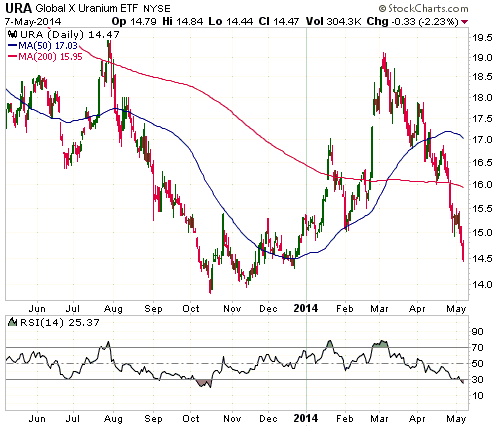
URA is now very 'oversold' and rapidly approaching last year's low near $14. We
suspect that the test of last year's low will be successful, but at this time we
aren't inclined to buy. This is mostly because we are far more
comfortable/confident buying weakness in the gold-mining sector.
Note that Energy Fuels (EFR.TO, UUUU), the one uranium producer in the TSI
Stocks List, will not be adversely affected at an operational level by
additional short-term weakness in the uranium price. The reason is that EFR's
production is being sold into long-term contracts with a floor price of around
$58/pound. In fact, on a short-term basis EFR gets a small benefit from the
weakness in the spot uranium market because it plans to buy 300K pounds on the
spot market this year for delivery into one of its long-term contracts.
The Stock Market
The US
The S&P500 Index (SPX), the highest-profile (among professional traders) and
most important US stock index, continues to hover just below its all-time high
and will possibly make a new high within the coming few days.
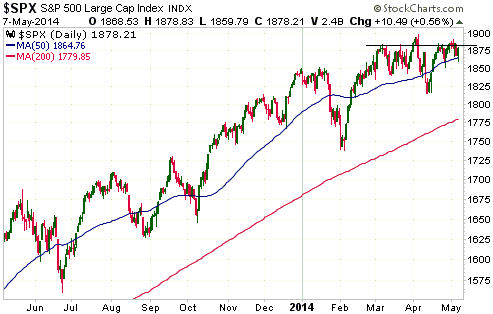
At the same time, many other US stock indices that act as indicators of US
economic performance and broad-based market strength are showing weakness and
are breaking down relative to the SPX. The most notable of these other indices
are the NASDAQ100 Index (NDX), the Russell2000 Small-Cap Index, the Banking
Index, and indices representing the home-building and retail sectors of the
economy. For example, the top section of the following daily chart suggests that
the NDX has been tracing out a head-and-shoulders top over the past 6 months and
the bottom section of the same chart shows that on a relative-strength basis the
NDX has been in a steep downward trend since mid-February.
We thought that the period from last week through to the end of this week was
the most likely time for an intermediate-term high in the SPX and secondary
(lower) highs in the NDX and several other indices. That's still the case.
Russia
Parts of the US mainstream media and several prominent US politicians have been
trying desperately to turn the Ukraine situation into a world-shaking crisis. At
this stage, however, the financial markets are saying that the turmoil in the
Ukraine and the associated economic sanctions against Russia are not important.
As evidence we present a daily chart of the Market Vectors Russia ETF (RSX). Due
to the fact that RSX is a proxy for the performance of Russian equities in US$
terms, it takes into account the performances of the Russian stock market and
the Russian currency (the Ruble).
The chart shows that RSX bottomed about two months ago, made a higher low last
month, and is now close to breaking out to the upside from what appears to be a
multi-month basing pattern.
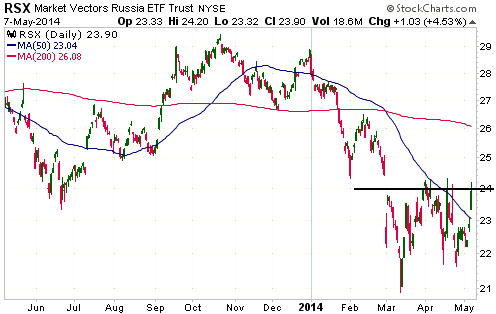
For the past several years the Russian stock market, as represented by RSX, has
traded like a leveraged play on the emerging-market and commodity themes. In
this regard there is currently no sign that anything has changed.
Gold and the Dollar
Gold
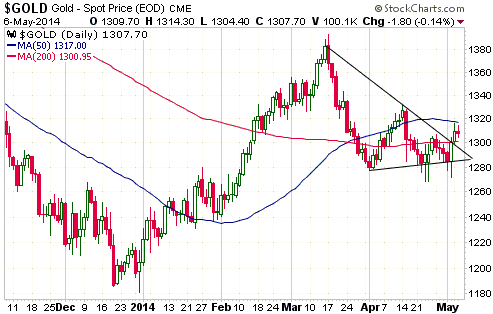
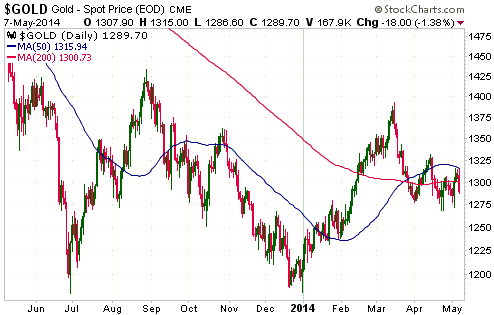
*Posted after the close of trading on 6th May:
The Dollar Index dropped almost half a point on Tuesday 6th May to a
new 6-month low. The question is: why didn't gold benefit from this
weakness in the US$?
Our answer has three parts, the first of which is: in a way, it did
benefit. Three trading days ago (on 1st May) the Dollar Index closed
at 79.6 and the US$ gold price closed at $1284.70. Two trading days
later (on 5th May) the Dollar Index again closed at 79.6 while gold
closed at $1309.50. That is, in the two trading days prior to
Tuesday's pronounced weakness in the US$ the gold price gained about
$25/oz in parallel with a flat Dollar Index. Furthermore, Monday's
$9 gain resulted in an upside breakout in the gold price from the
contracting range of the past two months (see chart below). Perhaps,
then, the gold market anticipated the weakness in the US$.
The second part of our answer is that even though the Dollar Index
has moved to a new 6-month low, it is still above critical support
at 79 and within its intermediate-term trading range. It looks like
an important downside breakout will happen soon, but it hasn't
happened yet.
The final part of our answer is that the US dollar's exchange rate
is just one of several influences on the gold market. Moreover, our
bullish view of the gold market has very little to do with our
expectation that the Dollar Index is likely to trend downward over
the next several months. From our perspective, weakness in the US
dollar's exchange rate would be "icing on the cake". The cake itself
comprises credit spreads, the yield curve, the relative strength of
the banking sector, the real interest rate and the performance of
the US stock market.
Things aren't happening as quickly as we'd like and consolidations
in gold-related investments seem to be taking forever to reach their
conclusions, but, stepping back and considering the overall picture,
all of the major financial markets (gold, currencies, T-Bonds,
commodities and equities) are currently doing roughly what we
expect.
*Update based on 7th May trading session:
Gold negated its minor 5th May upside breakout by dropping almost $20 on
Wednesday 7th May. The 50-day MA seems to be the nearby resistance that matters,
because during each of the past three trading days the gold price reversed
downward after touching this moving average. On a short-term basis we are
therefore back to the proverbial "square 1" -- anticipating a rally, but not yet
getting any confirmation from the price action that a rally is about to begin.
The inverse relationship between gold and the US stock market appears to be the
most important short-term influence on the gold market at this time.
Consequently, the SPX might have to start trending downward before the gold
price commences its next upward trend.
It is almost never reasonable to be confident about what the price of any
investment will do over the ensuing few weeks, because the shorter the timeframe
the more random the price fluctuations. However, looking beyond the next few
weeks we could hardly be more bullish about gold's prospects. In our opinion,
there is not a significant risk of gold revisiting its 2013 low, let alone a
significant risk of it breaking well below its 2013 low. That hardly anyone --
apart from the people who are always bullish, no matter what -- agrees with us
only increases our bullishness.
Gold Stocks
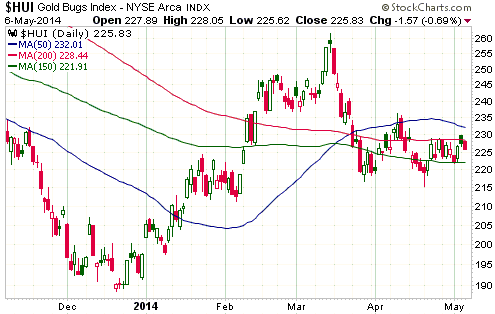
*Posted after the close of trading on 6th May:
The HUI continues to oscillate within a narrow range bounded by its
150-day and 200-day moving averages (the red and green lines on the
following chart). It moved up to the top of this range (229) during
Monday's trading session and has since pulled back to near the
middle of the range. The bottom of the range lies at 221.
The most likely outcome is that a break to the upside will occur
within the next few days. However, an equally bullish possibility is
that there will be a short-lived break below the bottom of the range
prior to a sustained turn to the upside. That is, a false downside
breakout could precede the start of the next meaningful rally.
If our short-term outlook is close to the mark, one thing the HUI
should not do is close below 215.
*Update based on 7th May trading session:
The following daily chart compares the HUI and the GDXJ/GDX ratio.
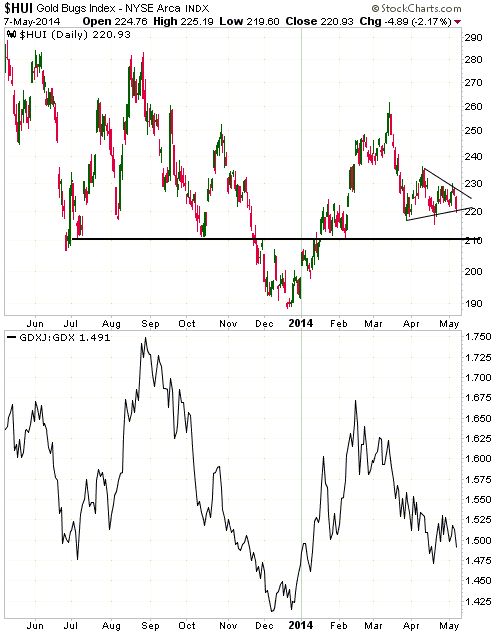
On Wednesday 7th May the HUI closed slightly below the bottom of the narrow
range bounded by its 150-day and 200-day moving averages. This opens up the
possibility that there will be a test of short-term support at 215 or
intermediate-term support at 210 before the next rally gets underway.
We will be watching the GDXJ/GDX ratio closely over the days ahead, especially
if the HUI spikes down to 215 or lower. A spike to a new multi-month low by the
HUI combined with GDXJ/GDX holding above its mid-April low would be a bullish
divergence, whereas a move to a new multi-month low by the GDXJ/GDX ratio would
indicate that the downward trend of the past two months was still in force.
The Currency Market
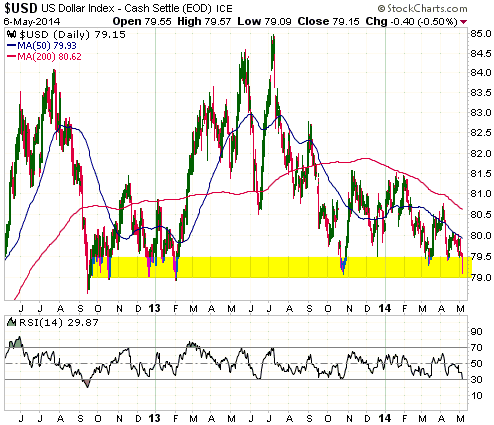
*Posted after the close of trading on 6th May:
Strong economic data from Europe (the service-sector PMIs for
several euro-zone economies were better than anticipated) boosted
the euro's exchange rate on Tuesday 6th May.
As we regularly point out, it's often the market reaction to
economic news rather than the news itself that contains the most
useful information. For example, bullish news for a market will
usually prompt a rally when the market in question is in a
short-term upward trend and usually be ignored when the market in
question is in a short-term downward trend. Furthermore, it's rare
for a market trend to change in response to economic news.
The currency market's reaction to Tuesday's news out of Europe is
therefore evidence that, for the moment, the euro remains in a
short-term upward trend. Given that the US$/euro exchange rate is
almost 60% of the Dollar Index, a short-term upward trend in the
euro implies a short-term downward trend in the Dollar Index.
The following daily chart shows the precarious position of the
Dollar Index. It is poised just above critical support at 79. It is
also -- as illustrated by the RSI at the bottom of the chart --
'oversold' on a short-term basis. The 'oversold' condition could
soon lead to a multi-week consolidation, but we suspect that there
will be a break below 79 before the start of such a consolidation.
Ideally, the Dollar Index will trade far enough below 79 within the
coming fortnight to enable the 79.0-79.5 range to act as resistance
during a subsequent rebound.
Updates
on Stock Selections
Notes: 1) To review the complete list of current TSI stock selections, logon at
http://www.speculative-investor.com/new/market_logon.asp
and then click on "Stock Selections" in the menu. When at the Stock
Selections page, click on a stock's symbol to bring-up an archive of
our comments on the stock in question. 2) The Small Stock Watch List is
located at http://www.speculative-investor.com/new/smallstockwatch.html
Chart Sources
Charts appearing in today's commentary
are courtesy of:
http://stockcharts.com/index.html
http://www.bloomberg.com/

|
