![]()
![]()
![]()
![]()
- Interim Update 7th June 2017
Copyright
Reminder
The commentaries that appear at TSI
may not be distributed, in full or in part, without our written permission.
In particular, please note that the posting of extracts from TSI commentaries
at other web sites or providing links to TSI commentaries at other web
sites (for example, at discussion boards) without our written permission
is prohibited.
We reserve the right to immediately
terminate the subscription of any TSI subscriber who distributes the TSI
commentaries without our written permission.
Gold True Fundamentals
Model
To paraphrase Jim Grant, gold's
perceived value in US$ terms is the reciprocal of confidence in the Fed
and/or the US economy. Consequently, what we refer to as gold's true
fundamentals are measures of confidence in the Fed and/or the US economy.
We've been covering these fundamental drivers of the gold price in TSI
commentaries for almost 17 years. It doesn't seem that long, but time
flies when you're having fun.
Note that we use the word "true" to
distinguish the actual fundamental drivers of the gold price from the
drivers that are regularly cited by gold-market analysts and commentators.
According to many pontificators on the gold market, gold's fundamentals
include the volume of metal flowing into the inventories of gold ETFs,
China's gold imports, the volume of gold being transferred out of the
Shanghai Futures Exchange inventory, the amount of "registered" gold at
the COMEX, India's monsoon and wedding seasons, jewellery demand, the
amount of gold being bought/sold by various central banks, changes in mine
production and scrap supply, and wild guesses regarding JP Morgan's
exposure to gold. These aren't true fundamental price drivers. At best,
they are distractions.
In no particular order, the gold market's
six most important fundamental price drivers are the trends in 1) the real
interest rate (as indicated by the yield on the 10-year TIPS), 2) the
yield curve (as indicated by the 10yr-2yr yield spread), 3) credit spreads
(as indicated by the ratio of a Treasury Note ETF to a junk bond ETF or
the spread between a high-yield index and the 10-year T-Note yield), 4)
the relative strength of the banking sector (as indicated by the BKX/SPX
ratio), 5) the US dollar's exchange rate (as indicated by the Dollar
Index) and 6) commodity prices in general (as indicated by GNX). Even
though it creates some duplication, we should also include the bond/dollar
ratio (as indicated by ratio of the 30-year T-Bond price to the Dollar
Index).
Up until now we have taken the above-mentioned price
drivers into account to arrive at a qualitative assessment of whether the
fundamental backdrop is bullish, bearish or neutral for gold, but we are
now making a significant change to our approach. To remove all
subjectivity and also to enable changes in the overall fundamental
backdrop to be charted over time, we have developed a model that combines
the above-mentioned seven influences to arrive at a number that indicates
the extent to which the fundamental backdrop is gold-bullish.
Specifically, for each of the seven fundamental drivers/influences we
determined the weekly moving average (MA) for which a MA crossover catches
the most trend changes in timely fashion with the least number of
'whipsaws'. It's a trade-off, because the shorter the MA the sooner it
will be crossed following a genuine trend change but the more false
trend-change signals it will cause to be generated. We then assign a value
of 100 or 0 to the driver depending on whether its position relative to
the MA is gold-bullish or gold-bearish. For example, if the yield-curve
indicator is ABOVE its pre-determined weekly MA then it will be assigned a
value of 100 by our model, because being above the MA points to a
steepening yield-curve trend (bullish for gold). Otherwise, it will be
zero. For another example, if our real interest rate indicator is BELOW
its pre-determined weekly MA then it will be assigned a value of 100 by
our model, because being below the MA points to a falling
real-interest-rate trend (bullish for gold). Otherwise, it will be zero.
The seven numbers, each of which is either 0 or 100, are then averaged
to arrive at a single number that indicates the extent to which the
fundamental backdrop is gold-bullish, with 100 indicating maximum
bullishness and 0 indicating minimum bullishness (maximum bearishness).
The neutral level is 50, but the model's output will always be either
above 50 (bullish) or below 50 (bearish). That's simply a function of
having an odd number of inputs.
Before we get to charts showing the
historical performance of the Gold True Fundamentals Model (GTFM), we
point out that:
1) The fundamental situation should be viewed as
pressure, with a bullish situation putting upward pressure on the price
and a bearish situation putting downward pressure on the price. It is
certainly possible for the price to move counter to the fundamental
pressure for a while, although it's extremely likely that a large price
advance will coincide with the GTFM being in bullish territory most of the
time and a large price decline will coincide with the GTFM being in
bearish territory most of the time.
2) The effectiveness of
fundamental pressure will be strongly influenced by sentiment (as
primarily indicated by the COT data) and relative valuation (as primarily
indicated by the gold/commodity ratio). In particular, if the fundamental
backdrop is bullish and at the same time the gold/commodity ratio is high
and the COT data indicate that speculators are aggressively betting on a
higher gold price then it is likely that the bullish fundamental backdrop
has been factored into the current price and that the remaining upside
potential is minimal. By the same token, if the fundamental backdrop is
bearish concurrently with the gold/commodity ratio being low and the COT
data indicating that speculators are pessimistic about gold's prospects
then it is likely that the bearish fundamental backdrop has been factored
into the current price and that the remaining downside potential is
minimal. The best buying opportunities therefore occur when a bullish
fundamental backdrop coincides with pessimistic sentiment and a low
gold/commodity ratio.
Getting down to brass tacks, here is a weekly
chart comparing the GTFM with the US$ gold price since the beginning of
2002. Unfortunately, we couldn't calculate the GTFM further back than 2002
because we don't have earlier data for some of the model's inputs.
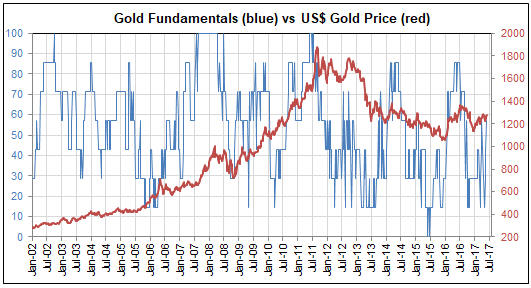
The above chart is too cluttered to see what's going on, so here's a
chart that zooms in on the period from December-2010 to last week.
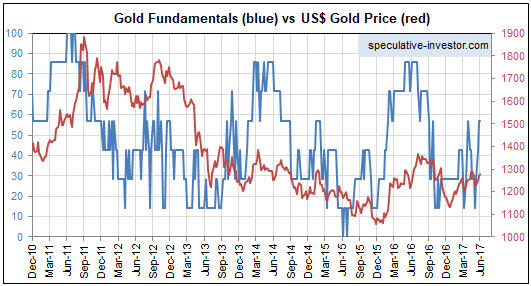
It is apparent from the second of the above charts that there is a
positive correlation between the GTFM and the price, which, of course,
should be the case if the GTFM is a valid model. If you look closely it
should also be apparent that the fundamentals (as represented by the GTFM)
tend to lead the gold price at important turning points. For example, the
GTFM turned down in advance of the gold price during 2011-2012 and turned
up in advance of the gold price in 2015 (the GTFM bottomed in mid-2015
whereas the gold price didn't bottom until December-2015).
The
tendency for gold to react to, rather than anticipate, changes in the
fundamentals is not a new development, as evidenced by gold's delayed
reaction to a major fundamental change in the late-1970s. We are referring
to the fact that by the second half of 1978 the monetary environment had
already turned decisively gold-bearish, but the gold price subsequently
experienced a massive rally that didn't culminate until January-1980.
Finally, we will calculate the GTFM at the end of each week. It was in
bullish territory at the end of the past two weeks and will be in bullish
territory at the end of this week unless something dramatic happens over
the next two trading days.
The Stock Market
The US
The US stock market was as quiet as a market can get over the first three
days of this week. None of the indices we usually discuss did anything
worth commenting on, but this is an opportune time to take another look at
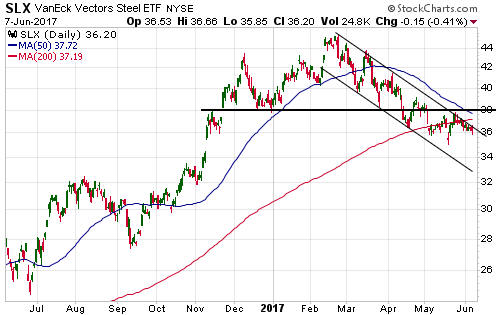
the steel sector. It's opportune because the VanEck Steel ETF (SLX) has
drifted downward near its channel top over the past three weeks and will
soon have to either signal an upward reversal by breaking above resistance
or signal the start of an accelerated decline by breaking below support.
The channel top is at $36.50-$37.00 and trend-defining lateral
resistance is at $38.00, so a daily close above $37.00 would warn that an
upward reversal was in the works and a weekly close above $38.00 would
confirm that the short-term trend had reversed.
Support lies at
$35.00-$35.50. A daily close below $35.00 would suggest that the
post-election rally was going to be fully retraced via a decline to $32 or
lower.
The only other point worth mentioning is that there have been two "Hindenburg
Omen" signals over the past 5 weeks, with the most recent occurring
last week. A Hindenburg Omen is a warning that a large stock market
decline will commence within the coming month and in the past it has never
failed to provide timely warning of a large stock market decline. The
problem is that most of the signals turn out to be false. In other words,
the Hindenburg Omen has generated no false negatives and many false
positives.
The Hindenburg Omen shouldn't be used in isolation, but
the recent occurrence of this signal adds to the evidence that the current
environment is high-risk.
Europe
The EURO
STOXX 50 Index (STOX5E), the European equivalent of the Dow Industrials
Index, peaked in early-May and has since pulled back to its 50-day MA. If
this is a routine correction to a short-term upward trend then the decline
should end near its current level, whereas a daily close below 3500 would
warn that the short-term upward trend was over.
Gold and the Dollar
Gold
Unsurprisingly, the US$ gold price moved up to test its April high of
around $1300 during the first half of this week. It's likely to spike
above $1300 before making a multi-week top, but the big question is: Will
there be a sustainable break above $1300 in the near future?
With the current fundamental backdrop skewed bullishly for gold a
sustainable breakout is a realistic possibility, although we remain
sceptical. The main reason is the multi-month bearish divergence between
the gold-mining sector and the bullion market, which didn't disappear as a
result of Tuesday's impressive strength in the gold-mining sector. Another
reason is that sentiment and relative valuation indicate that the
gold-bullish fundamental backdrop could already be factored into the
price.
That being said, it is now looking less likely that we will
get an important low during the June-July period. In fact, if gold is able
to end this week above $1300 then we could be looking at a June-July high
(similar to last year), which would be a good match for what we expect in
the T-Bond market and would also be consistent with a significant decline
in the US stock market within the next several weeks.
We'll have
more to say on this topic in the Weekly Update.
Gold Stocks
Current Market Situation
The
gold-mining indices and ETFs are all in slightly different positions on
the charts. Specifically:
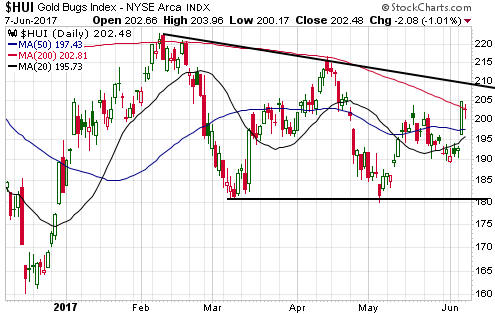
1) The HUI began Tuesday below its
20-day, 50-day and 200-day MAs, but ended the day above all of these MAs.
It then dropped a little and ended Wednesday's session almost exactly at
its 200-day MA. Also, it remains comfortably below the downward-sloping
trend-line drawn from the February peak.
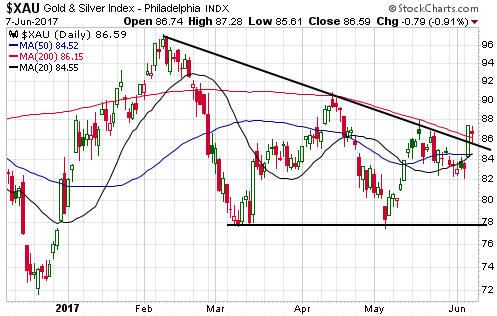
2) In addition to breaking above its 20-day, 50-day and 200-day MAs,
the XAU has broken above the downward-sloping trend-line drawn from the
February peak.
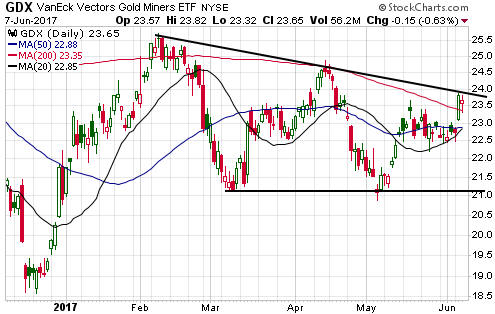
3) The chart position of the VanEck Gold Miners ETF (GDX) is slightly
stronger than that of the HUI and slightly weaker than that of the XAU. It
is above its 200-day MA and tested its downward-sloping trend-line during
the first half of the week.
4) The Global X Gold Explorers ETF (GOEX) has been hurt by the
infamous GDXJ re-balance that is due to be complete at the end of next
week. It broke decisively below its March low in early-May and has not yet
rebounded to its 200-day MA.

One thing these indices and ETFs have in common is that Tuesday's
surge possibly constituted a significant change. We'll discuss the
implications in the Weekly Update.
Note that if a short-term trend
reversal (to the upside) has occurred then at least one of the final two
trading days of this week should be up-days.
Gold stocks for a multi-month trade, update 1
In the 24th May Interim Update we mentioned 5 gold-mining stocks that
were potential additions to the TSI Stocks List as short-term trading
positions. The stocks were AKG, CNL.TO, PG.TO, RMS.AX and SAND.
Due
to company-specific developments, AKG has almost ruled itself out as a
potential trading position. We say "almost", because the information
provided by management early this week regarding the Expansion Feasibility
Study suggests that the short sellers are wrong about the company needing
to tap the capital markets within the next 12 months to sustain its
production. Unless AKG's senior management is outright lying and thus
leaving itself open to legal problems that are far more serious than the
time-wasting class-action lawsuits initiated recently by a gaggle of
ambulance-chasing lawyers, the company will remain in good financial shape
over the next year or two regardless of whether it gets additional
financing.
Based on the information we have today, AKG would be a
reasonable speculation if it were to drop back to near last week's low
(US$1.25-$1.30). It is probably worth substantially more than $1.30 in the
current gold-market environment and probably won't drop that far, but
given the risks and unknowns we'd require that price or lower to make the
risk/reward sufficiently attractive.
The other stocks have rallied
with the gold-mining sector and are now a long way above the prices at
which we had hoped to add them to the TSI List. Does this mean that we
should pay up?
How anyone responds to a changing market will always
be at least partly determined by their existing positioning. For example,
we have plenty of exposure to gold-mining stocks in the TSI List and in
our own account, so we are not inclined to pay significantly more than the
prices previously mentioned. However, we would be less stingy with regard
to new buying if our existing exposure to the gold-mining sector was
substantially less.
Keeping in mind that a major rally is probably
NOT about to begin, if you currently feel under-exposed to gold-mining
stocks you could buy the Global X Gold Explorers ETF (GOEX) for a trade in
the US$22-$23 range and set an initial stop slightly below the early-June
low (near $21). Alternatively, you could choose to take greater risk in an
effort to get much higher returns by taking positions in some junior gold
and/or silver miners that are 'oversold' and trading at relatively low
valuations.
BLK.AX and GRG.V are two examples from the TSI Stocks
List. US Gold Corp. (NASDAQ: DRAM), a stock that was briefly written-up
and added to the TSI Small Stocks Watch List in the 22nd May Weekly
Update, is also worth considering near its current ultra-depressed level
in the US$2.60s, although not as a short-term trade. DRAM's long-term
reward/risk is very attractive near its current price, but even though its
liquidity has recently improved it is still too illiquid to be a
short-term trading vehicle.
The Currency Market
It has been a very uneventful week to date in the currency market.
However, there are three events scheduled for Thursday 8th June with the
potential to generate some volatility.
The first event is the UK
election. Despite the closeness indicated by some opinion polls over the
past two weeks, the currency market and the other financial markets have
been assuming that common-sense would prevail and that Theresa May's party
would be successful in the end. Putting it another way, if the markets had
assigned a significant probability to a victory by the Corbyn-led Labour
Party then the Pound and the FTSE100 would have tanked. The financial
markets got the "Brexit" outcome completely wrong, but being completely
wrong about the election outcome would be a much bigger surprise.
The second event is the ECB Meeting. This meeting could be more important
than the average ECB get-together because it could result in the first
small step away from ultra-loose monetary policy. The currency market has
been expecting a small step in that direction, which is partly why the
euro has rallied.
The third event is the testimony to be given by
former FBI chief James Comey about the Russian government's supposed
intervention in the US election. This is a chapter in a non-story that has
been blown up by the media and Trump's political enemies into a huge story.
Updates on Stock Selections
Notes: 1) To review the complete list of current TSI stock selections, logon at
http://www.speculative-investor.com/new/market_logon.asp
and then click on "Stock Selections" in the menu. When at the Stock
Selections page, click on a stock's symbol to bring-up an archive of
our comments on the stock in question. 2) The Small Stock Watch List is
located at http://www.speculative-investor.com/new/smallstockwatch.html
Chart Sources
Charts appearing in today's commentary
are courtesy of:
http://stockcharts.com/index.html
![]()