![]()
![]()
![]()
![]()
- Interim Update 7th August 2019
Copyright
Reminder
The commentaries that appear at TSI
may not be distributed, in full or in part, without our written permission.
In particular, please note that the posting of extracts from TSI commentaries
at other web sites or providing links to TSI commentaries at other web
sites (for example, at discussion boards) without our written permission
is prohibited.
We reserve the right to immediately
terminate the subscription of any TSI subscriber who distributes the TSI
commentaries without our written permission.
Currency Manipulation
In the email sent to subscribers
after the close of US trading on Monday 5th August we wrote that the
catalyst for Monday's stock market sell-off was news that the Chinese
government's retaliation to last Thursday's US government tariff decision
would include Yuan devaluation. We also pointed out that in this case it
isn't accurate to use the word "devaluation", because that implies
manipulation to weaken the Yuan relative to the US$ when in reality
China's government had -- temporarily at least -- stopped trying to
prop-up the Yuan. That is, what we were witnessing was the ceasing of
actions designed to keep the Yuan artificially strong. Finally, we noted
the irony that the removal of this manipulative force could prompt the US
Treasury to cite China as a currency manipulator.
As if on cue, a
short time later the US Treasury labeled China a "currency manipulator".
The implied message to China's government is: if you STOP manipulating
your currency in the direction we want then we will call you a currency
manipulator. Government logic at its best.
Monday's managed
weakness in the Yuan was largely symbolic, for two reasons. First, more
than 50% of the cost of the average exported item from China is accounted
for by imported goods and materials, so to use the currency to fully
offset the effect of a 10% US tariff the Yuan would have to fall by more
than 20% against the US$. The trade-related effect of Monday's 1.5% Yuan
decline is therefore negligible. Second, China's government would be well
aware that a significant decline in Yuan/USD over a short period could
precipitate the sort of financial-market upheaval that would have negative
ramifications for China's economy.
The Yuan is very over-valued and
will get a lot weaker at some point, but substantial weakness is unlikely
in the short-term for the reason mentioned directly above, that is,
because the resulting disturbance to the financial markets would be as
much of a problem for China as it would be for any other country. What
appears to have occurred early this week is a warning shot from China's
government. The warning to the US government is: if you continue to use
protectionist measures as a negotiation tactic then we will stop
propping-up the Yuan.
The Stock Market
The disconnect between
the stock market and corporate profits
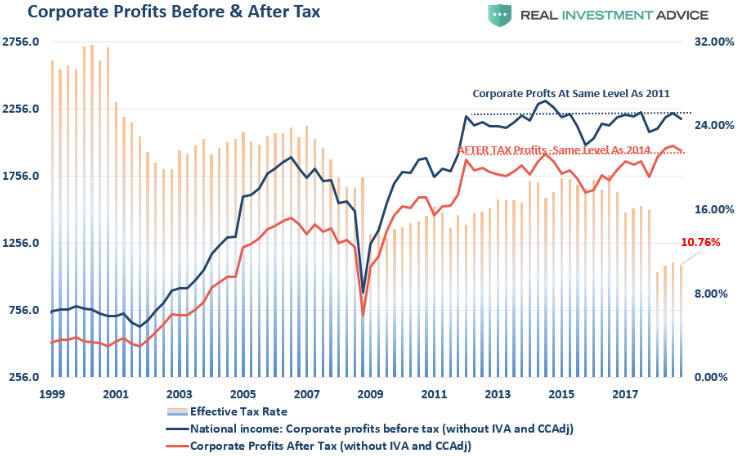
In light of the US
stock market's strong long-term upward trend, the following chart is
extraordinary. The chart shows that US pre-tax corporate profits are no
higher today, and that US post-tax corporate profits are only slightly
higher today, than they were in 2011. The implication is that the bullish
stock market trend of the past 8 years went hand-in-hand with no growth in
total corporate profitability. Given that the stock market didn't look
cheap in 2011, how could this be?
One part of the two-part answer
is that the stock market's average P/E ratio has trended upward, meaning
that 'investors' have been willing to pay increasingly-larger amounts for
the same earnings. The second and less obvious part of the answer is that
although total US corporate profits have gone sideways over the past 8
years, thanks to share buybacks there has been decent growth in the profit
per share. This is especially the case for the large-cap companies that
make up the S&P500 and NASDAQ100 indices. In 2018 alone, listed US
corporations bought back about 1 trillion dollars of their own shares.
This means that the greatest monetary stimulus in history didn't work
as intended. It was supposed to boost the sort of corporate investment
that leads to a general increase in prosperity, but instead its most
obvious effect was to boost the popularity of financial engineering. Due
to a deluge of cheap credit it has made sense for many (not all) corporate
managements to borrow money to buy back their company's own shares at
ever-higher prices, thus achieving significant earnings-per-share growth
while taking almost no risk, rather than go down the harder and riskier
path of growing the actual business.
The economic theories that
were put into practice over the past 10 years did not work as advertised.
Unfortunately, these theories are still guiding the actions of
policy-makers in all major central banks and governments.
Current Market Situation
It should go without saying that
the sort of sudden weakness in the stock market that occurred on Monday of
this week is an opportunity for the holders of bearish option positions,
such as SPY put options, to take profits. If you are an options trader and
you find yourself with a large profit thanks to dramatic market action,
then taking some money off the table should be an automatic response.
Don't wait for us or any other analyst/advisor to make the profit-taking
suggestion. In this particular case we did make a profit-taking suggestion
via email, but by then the optimum time to exit had past.
We
emailed subscribers after the close of trading on Monday to highlight the
opportunity that had been created by the day's dramatic market action.
Here's how we summed up the situation:
"For those holding
short-dated bearish speculations the most reasonable tactic would be to
take profits on half of the position now with the aim of a) exiting the
balance when the stock indices drop to lower levels late this month or
early next month, and b) using part of the aforementioned profit to add a
new short-dated bearish speculation following a significant multi-day
market rebound. That's what we plan to do in our own account, except that
we almost certainly will make a complete exit from our bearish position if
the SPX plunges to the mid-2700s within the next two days (the index ended
Monday's session at 2845). For TSI record purposes, however, we will
assume that the total position is exited now and will look for an
opportunity to add a new position within the next two weeks."
If you were holding bearish option speculations and weren't quick enough
to take advantage of the circumstances that arose early this week, it
might not matter because there probably will be an even better
profit-taking opportunity before the end of this month. Also, if the SPX
rebounds to near its 50-day MA within the next few days it should be
viewed by short-term traders as a good chance to establish a new bearish
speculation in anticipation of a near-term drop to well below Monday's
low.
As illustrated by the following chart, the SPX's 50-day MA is
at 2931 and is rising.
The Dow Transportation Average (TRAN), which yet again has led to the
downside, broke below channel support last week and has since fallen by
enough to test important lateral support at 10,000.
For the SPX, the short-term downside target we have in mind is the
early-June low (around 2730). Given the bearish fundamental backdrop it
ultimately could drop a lot further than that, but it should at least test
its June low before the next multi-month bottom is in place.
For
the TRAN we are expecting a decline to well below the early-June low prior
to the next multi-month bottom.
Gold and the Dollar
Gold
In
the latest Weekly Update we noted that gold's price action since 25th June
looked like a consolidation with a slight upward bias. That is, although
the price hadn't fallen it was fair to say that in US$ terms gold had been
in correction mode for about 6 weeks (with numerous successful tests of
the 20-day MA along the way).
At the end of last week there was no
evidence that the correction was over, leaving open the possibility of a
decline to as low as $1350 prior to the upward trend resuming. However,
the US$ gold price clearly broke out to the upside on Monday in reaction
to the Chinese government's retaliation to last week's US government
decision to impose additional taxes on China-sourced imports. The gold
market built on Monday's upside breakout over the ensuing two days.
The top of the 6-week consolidation (around $1450) is now important
support. Closing below this support would signal a short-term trend
reversal.
Due to this week's surge the gold market has achieved the upside
target we had in mind for this year (the low-$1500s). The fundamental
backdrop remains supportive and there is no evidence that the rally is
over, but the short-term downside risk is now high due to the market being
extremely stretched in both momentum and sentiment terms. It won't
surprise us if the surge continues for another 1-4 weeks, but almost
regardless of what happens over the next month there's a good chance that
the price will trade comfortably below its current level within the next
three months. Therefore, this is a time to be scaling out of gold
exposure, not adding to it.
Although there is no evidence that gold
has reached a short-term price top, one warning sign of an impending
short-term top emerged over the past few days. We are referring to the
fact that the HUI/gold ratio has not confirmed this week's upside breakout
in the gold price. As illustrated by the following chart, the ratio
remains below its mid-July high.
For the HUI/gold ratio to generate
a clear-cut bearish signal it would have to close below its 40-day MA,
which it has not done. However, any sort of divergence between the bullion
price and the gold-mining sector can be meaningful when the bullion price
is stretched to either the upside or the downside.
Silver
The US$ silver price also broke out to
the upside and thus completed its short-term correction over the first
three trading days of this week. The September silver futures contract
ended Wednesday's session at US$17.20 and only needs to finish this week
above US$16.48 to solidify its longer-term upside breakout.
Like the gold market the silver market is now stretched to the upside
in both momentum and sentiment terms, although at current prices silver is
a better candidate for new buying than gold. There remains the potential
for silver to make a big catch-up move within the next few months.
A warning that a short-term (1-3 month) top is in place would be generated
by a daily close below the 20-day MA. The 20-day MA is at $16.20 and is
rising rapidly.
By the way, at current metal prices ($1520 for
gold, $17.20 for silver and $870 for platinum) platinum is a much better
buy than either gold or silver. The platinum market is not 'stretched' to
the upside by any measure and platinum remains extremely cheap relative to
gold. As previously advised, platinum must achieve a weekly close above
US$920 to decisively break out to the upside and project a rise to at
least $1200.
Gold Stocks
The sharp rise in
the gold price to above $1500/oz on Wednesday 7th August didn't generate
much excitement in the gold-mining sector. A big part of the reason is
probably the HUI's proximity to obvious, major resistance at 220. As
illustrated by the following chart, the resistance is defined by the 2017
double top.
The HUI traded as high as 228 at one point on Wednesday before pulling
back to end the day almost exactly at 220, with a net gain on the day of
only 0.7%. This suggests to us that large, technically-oriented traders
began selling the HUI's component stocks (all of the senior and most of
the mid-tier gold producers) after 220 was reached.
Resistance for
the HUI at 220 is equivalent to resistance for GDX at $25. GDX blew
through its resistance more than a month ago and we expect that the HUI
will do the same, but not necessarily right away.
Another daily HUI
chart is displayed below. This one zooms in on the more recent price
action.
We noted in real time that both the 'oversold' extreme (in
momentum terms -- as indicated by the daily RSI) reached in August of last
year and the 'overbought' extreme reached in June of this year had bullish
implications regarding the likely performance over the coming few months.
At the moment there is a momentum divergence (a divergence between the
daily RSI and the price) involving higher highs for the price and lower
highs for momentum. This could have short-term bearish implications.
We are anticipating a sizable 1-2 month correction in the gold-mining
sector that could begin immediately but might not begin for another 2-4
weeks. We expect that this correction will be followed by a rally to new
multi-year highs.
If you have substantial exposure to the
gold-mining sector we suggest that you start taking some money off the
table. During the first half of this week we took partial profits on two
gold-stock positions and have above-the-market sell orders in place with
the aim of taking partial profits on a few other gold-stock positions.
The Currency Market
After last week's Fed
meeting the Fed Funds Futures (FFF) market was 'saying' that there
probably would be just one more rate cut before year-end. The FFF market
is now saying there is a 100% chance of two more rate cuts and about a 50%
chance of a third additional rate cut before year-end. In other words,
expectations regarding what the Fed will do are changing rapidly.
These changes are affecting the Dollar Index (DX). After poking its head
above resistance at 98.1 last Wednesday-Thursday during the hours after
the Fed's announcement the DX has since dropped back to support at around
97.2.
We guess that the 'choppy' price action will continue for at
least a few more weeks.
Almost everyone's focus this week has been on the Yuan. As illustrated
by the following weekly chart, the USD/Yuan exchange rate has broken out
to the upside. Note that a rising line on this chart indicates a weakening
Yuan. The move is too small to affect the prices paid/received in US-China
trade, but the break above an obvious demarcation level had an outsized
effect on sentiment.
Updates on Stock Selections
Notes: 1) To review the complete list of current TSI stock selections, logon at
http://www.speculative-investor.com/new/market_logon.asp
and then click on "Stock Selections" in the menu. When at the Stock
Selections page, click on a stock's symbol to bring-up an archive of
our comments on the stock in question. 2) The Small Stock Watch List is
located at http://www.speculative-investor.com/new/smallstockwatch.html
Chart Sources
Charts appearing in today's commentary
are courtesy of:
https://stockcharts.com/
http://bigcharts.marketwatch.com/
![]()