|
- Interim Update 7th September 2011
Copyright
Reminder
The commentaries that appear at TSI
may not be distributed, in full or in part, without our written permission.
In particular, please note that the posting of extracts from TSI commentaries
at other web sites or providing links to TSI commentaries at other web
sites (for example, at discussion boards) without our written permission
is prohibited.
We reserve the right to immediately
terminate the subscription of any TSI subscriber who distributes the TSI
commentaries without our written permission.
The
great inflation-deflation debate continues
In a recent
blog post Mike Shedlock declared victory for himself and the other supporters of the deflation side of the great debate*. Strangely, he did this at a time when he was never more wrong about the inflation-deflation issue. But, that's "Mish".
Fortunately, Eric Janszen of www.itulip.com went to the trouble of setting "Mish" straight. Janszen's rebuttal is posted
HERE
and deserves to be read in full, but here are some pertinent excerpts along with our own comments:
1) "When the private credit markets seize up as they did following the great crash of 1929 and again in 2008, the central bank can expand the money supply by making ledger entries on both the assets and liabilities sides of the central bank's balance sheet.
Under a gold standard, the legal requirement to have physical gold backing entries to the liabilities side of the ledger limited the ability of the central bank to do this. That's the whole point of the gold standard, to remove the option of politicians to pressure the central bank into generating seigniorage revenue from money creation when tax and borrowing revenues fall short. Without the legal requirement to have gold reserves backing the central bank's ledger entries, the process of expanding the money supply is as simple as writing numbers down on the ledger and communicating the transaction to member banks, or today by typing the numbers on a keyboard and hitting "send.""
Our view: The difference in the monetary backdrops between now and the 1930s -- due primarily to the limitation on money creation imposed by the Gold Standard during the 1930s -- guarantees a different outcome for nominal prices during the current depression. By the way, the deflationary part of the Great Depression ended in 1933, but the Depression didn't end until around 1946.
2) "Prolonged and deep price deflation has not, will not, and cannot occur under our money system. I will gladly send you a plaque that you can put on your desk that reads: "No gold standard. No deflation." You can refer to it when the question crosses your mind and we won't have to go over this again and again.
"But wait!" you'll say, waving your hands around. "You're talking about falling prices! Falling prices aren't deflation!"
This brings me to my third issue with your tortured argument that deflation is occurring: your definitions are nonsensical.
You say:
"Many if not most economists, especially Keynesians, think of inflation in terms of prices.
"In contrast, Austrian-minded economists generally have definitions similar to mine except most of them fail to properly include credit in their analysis. Austrians in general look at money supply alone, and that is a huge mistake."
There is no confusion between the Keynesian and Austrian interpretations of the concept of inflation, on whether the money supply or prices are more relevant as measures of inflation. Both are equally relevant in economics in the way that the force of gravity and weight are equally relevant in physics. Saying "The money supply is a better indicator of inflation than prices" is like saying "The force of gravity is more relevant than weight." Weight is how we measure the force of gravity on an object. Producer and consumer prices are how we measure the impact of inflation on the economy."
Our view: We disagree with the Shedlock and Janszen comments included in the above excerpt.
Shedlock is wrong when he says that most Austrian-minded economists fail to properly include credit in their analysis. The truth is that most Austrian-minded economists do account for changes in the credit markets; however, they understand that credit and money are very different things and should therefore not be lumped together. They also understand that changes in money purchasing power are determined by changes in the supply of and the demand for MONEY.
Janszen is wrong when he says that there is no confusion between the Keynesian and Austrian interpretations of the concept of inflation. The reality is that there are huge differences in how these two schools understand/interpret the effects of monetary inflation. Most Austrians understand that monetary inflation causes changes in relative prices as well as the "general price level", and that these relative price changes alter the capital structure of the economy and set into motion the boom/bust cycle. From an Austrian perspective, changes in relative prices are often more important than changes in the so-called general price level. Most Keynesians (and Monetarists), however, believe that the only important price-related effect of monetary inflation is a rise in the general price level.
Using Janszen's weight analogy to explain the difference between the Austrian and mainstream views of inflation, imagine a person gaining 10% in weight and all of the weight gain being concentrated in the right leg. The scales would simply say that the person was 10% heavier, but a 10% weight gain concentrated in one leg has very different ramifications to a 10% weight gain evenly dispersed over the entire body. Austrians recognise and attempt to account for the difference; Keynesians generally do not.
3) "The way the government manages debt deflation iof [sic] private credit is via monetary inflation created by the central bank and via deficit spending by the federal government.
When consumers, businesses, and the credit markets are not lending new money into existence, the government and the central bank step up their lending, and lend one to the other, to expand the money supply."
Our view: We are in total agreement. There was always a good chance that the private sector would eventually reach the point where it was unable or unwilling to borrow more new money into existence. One of the consistent TSI themes over the past 10 years has been that after this point was reached, the money supply would continue to expand due to the central bank and/or government 'taking up the slack'.
4) "Private sector debt deflation means more government borrowing and money printing. That's why gold prices keep going up.
You favor gold too, but for the wrong reasons. You think gold prices will rise when the money supply is contracting and the economy is in deflation.
That's backwards. If deflation had in fact occurred, gold prices would have plummeted. Gold prices went up because reflation via monetary and fiscal policy measures succeeded, contrary to your assertion...
If you made any money on gold it's because you got lucky, like a man who bets money that the sun is going to rise in the east not because the earth is rotating on its axis but because he thinks the sun revolves around the earth."
Our view: People who bought gold to protect themselves from the coming deflation have proved that in the financial markets, two wrongs sometimes make a right. They were wrong to expect deflation and they were wrong to believe that gold would do well in the face of genuine deflation, but they ended up in the right place anyway.
*Like some other high-profile deflation forecasters, Shedlock wrongly characterises the debate as deflation versus hyperinflation. This is despite the fact that we and many other forecasters of relentless inflation have never said that hyperinflation was a realistic short- or intermediate-term prospect. Actually, we've consistently said the opposite. The Stock Market
Current Market Situation
The following daily chart shows that over Tuesday and Wednesday of this week the S&P500 Index spiked down to the bottom of its short-term price channel and then rebounded.
Nothing of significance has changed. Important resistance lies in the 1250s and important support lies in the low-1100s. There's a better-than-even-money chance that the low for the year is in place, but at the same time there's not a lot of upside potential and still sufficient downside risk to keep us alert.

Speculating on a European rebound
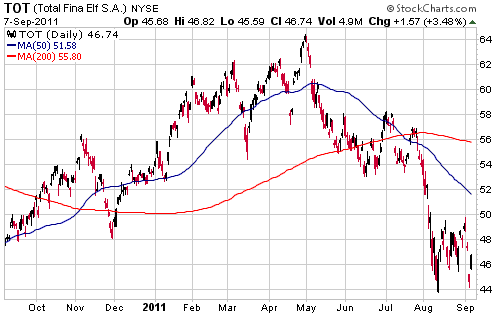
There are major problems in Europe's debt markets, but these problems don't necessarily imply that there is a lot of additional downside potential in Europe's equity markets. Some stocks will go to zero, but many stocks with solid underlying businesses have been clobbered due to market-wide fear. One example is the stock of the French company Total (NYSE: TOT). Total is one of the world's largest oil producers and is therefore not dependent upon European economic progress. It has, however, been pushed down to a very low valuation by the almost-palpable fear that has gripped the stock markets of Europe. Specifically, TOT now trades at a P/E of 6.5 (based on trailing 12-month earnings), an enterprise-value to revenue ratio of 0.58, and a price-to-cashflow ratio of around 4.
It could make sense to scale into TOT over the next two months and to buy TOT aggressively should general market fear push its price down to around $40.
It could also make sense to scale into the Guggenheim Shipping ETF
(SEA) over the next two months. Betting on any single shipping company would be risky, but betting that the world still needs plenty of shipping companies would not be. To put it another way, SEA's risk is mitigated by the fact that it holds a large number of shipping-related stocks.
Note that SEA provides significant exposure to the Greek stock market in that Greek stocks comprise about 13% of the ETF. We view this as a plus, because Greek companies involved in international shipping have almost no exposure to Greece's economy and yet they've been sold off along with everything else.
The following chart compares SEA with the Baltic Dry Index (BDI). Notice that SEA is languishing near its low for the year while the BDI just made a new high for the year.
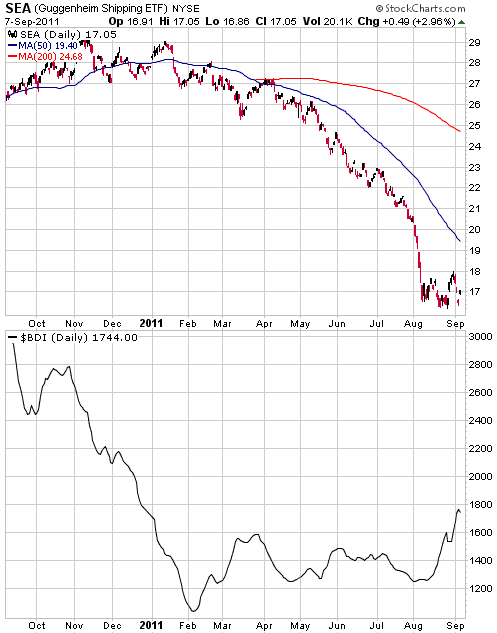
We aren't adding SEA or TOT to the TSI Stocks List; we are just mentioning them as speculative ideas that may be of interest to some of our readers. For each of these stocks, a reasonable approach would be to scale in over the next few weeks with the aim of catching a rebound to the 200-day moving average.
Gold and the Dollar
Gold
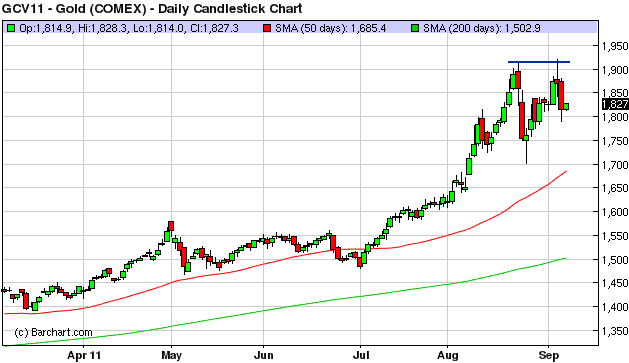
At this stage it looks like gold has just successfully tested its August peak and has resumed its correction. The moving averages shown on the following daily chart continue to define the likely and maximum downside targets for this correction.
This week's price action hasn't changed anything, but it has simplified things. The reason is that triple tops are rare. This means that if the gold price moved back up to the vicinity of its recent highs, the odds would be strongly in favour a decisive break to new highs.
Just to clear something up: Regardless of whether you use dollars or euros or Yen or cows or something else to buy gold, what you end up with is gold. You don't end up with US$-denominated gold or euro-denominated gold or cow-denominated gold. For accounting purposes you can express your gold investment in terms of anything you want, but the currency you use to make the purchase doesn't alter what you end up owning.
An implication is that if you want a position that will definitely benefit from both a rise in the US$ gold price and a fall in the EUR/USD exchange rate, you cannot establish the position by purchasing gold with euros. You can only establish it by simultaneously going 'long' gold futures and 'short' euro futures, or by purchasing a financial product that incorporates a long position in gold futures and a short position in euro futures.
Gold Stocks
Wednesday 7th September was another trading day where the gold sector of the stock market was pulled in one direction by a large move in the gold price and pulled in the opposite direction by a large move in the broad stock market, with the net result being little change in the gold-stock indices.
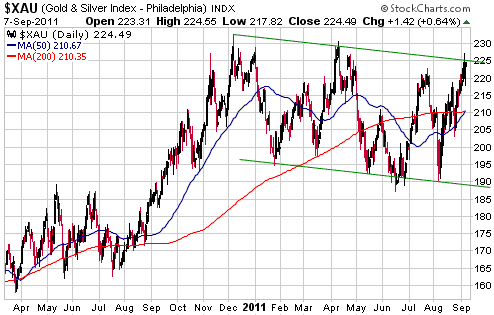
The following chart shows that the XAU hasn't yet confirmed the HUI's recent upside breakout. The question is: will it?
Our guess is yes, but obviously we don't really know. What we do know is that an XAU breakout would have a better chance of being sustained if it happened after the gold price had pulled back to its 50-day moving average or lower.
Right now, the gold market is 'overbought' and has potentially just double-topped. Although it could reasonably be argued that the average gold stock is already discounting a much lower gold price, it will be difficult for the gold-stock indices to rise while gold bullion is in the midst of a multi-hundred-dollar correction.
A normal short-term pullback in the XAU would find support at around 210.
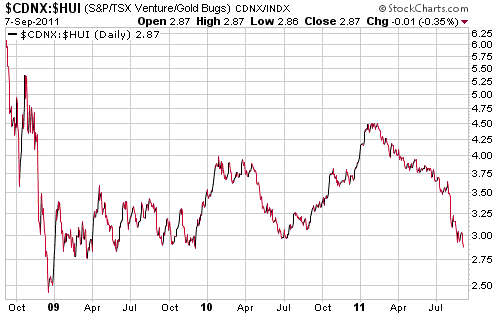
The following chart shows the CDNX/HUI ratio. In other words, the chart shows how junior resource stocks have performed relative to an index of top- and mid-tier gold producers. This ratio will usually trend upward as market participants (as a group) become more risk-tolerant and trend downward in the face of increasing market-wide risk aversion. It trended upward from July of last year until February of this year in response to "QE2", but has since been in a downward trend.
The pendulum could begin to swing back towards risk (the juniors) at any time. If history is a guide it will happen by December at the latest.
Currency Market Update
"The Swiss National Bank (SNB) is...aiming for a substantial and sustained weakening of the Swiss franc. With immediate effect, it will no longer tolerate a EUR/CHF exchange rate below the minimum rate of CHF 1.20. The SNB will enforce this minimum rate with the utmost determination and is prepared to buy foreign currency in unlimited quantities."
- From a statement issued by the SNB on 6th September
With the EUR/USD rate at around 1.40, a EUR/CHF rate of 1.20 implies a CHF/USD rate of 1.16-1.17. This compares to the 1.27 rate at which CHF/USD ended the trading day prior to the SNB's announcement. The SNB-imposed cap on the franc's level relative to the euro therefore led to an 8% plunge in the franc against the US$. The result is the gap shown on the following daily chart. This is the largest single-day move we've ever seen on the chart of a major currency, and is more evidence that the current monetary system, while not yet completely broken, is in a terrible state.
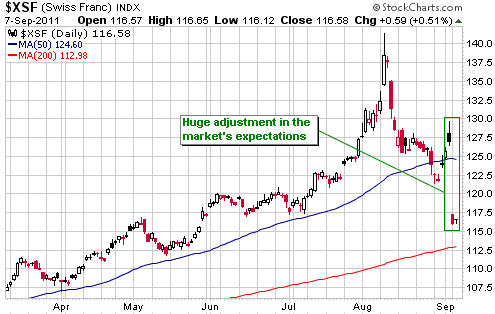
We mentioned that the Swiss franc was a speculative 'short' after it rocketed upward in early August, and noted that all the ingredients were in place for a major top following the initial decline from its early-August peak. This week's developments boost the probability that a major top has indeed been put in place, although we hasten to add that the price action of the past few weeks is consistent with
both an intermediate-term peak and a major peak.
There is no doubt that the SNB has the power to transform the franc into a weak currency. This is by virtue of the fact that like all central banks it has unlimited ability to increase the supply of the currency it has been charged with manipulating. One problem is that it could end up trying to weaken the franc against a currency that is, itself, being aggressively depreciated in a desperate effort to sustain an ill-conceived monetary union.
As an aside, this week's action by the SNB is another nail in the coffin of the deflation case. A currency that experienced deflation would move dramatically higher on the foreign exchange market, but if the financially-prudent Swiss are not prepared to tolerate substantial relative strength in their currency, then who will?
Moving along, Germany's Constitutional Court announced on 7th September that it would not get in the way of the euro-zone's bailout program. The only caveat is that the German government will not be allowed to commit more German taxes to bailouts without first getting the permission of the budget committee of the Bundestag lower house. This requirement could slow the pace at which future rescue packages are cobbled together, but the markets breathed a collective sigh of relief that one potential obstacle to more bailouts had been avoided.
The Swiss news helped the Dollar Index build on last Friday's minor upside breakout. The Dollar Index is still within its range of the past 5 months and therefore still needs a daily close above the top of the range (76.5) to clearly signal that an intermediate-term advance has begun, but the odds have shifted in favour of significant additional US$ strength. We have therefore upgraded our short-term US$ outlook from "neutral" to "bullish".

73.5 continues to be the most important nearby support level for the Dollar Index. However, if the US$ is in the early part of an intermediate-term advance then pullbacks over the next couple of months shouldn't do any worse than test the 50-day moving average (currently at 74.5). Consequently, consecutive daily closes below the 50-day moving average would seriously call into question our short-term bullish view; while a daily close below 73.5 would leave no doubt that we are wrong.
Update
on Stock Selections
Notes: 1) To review the complete list of current TSI stock selections, logon at
http://www.speculative-investor.com/new/market_logon.asp
and then click on "Stock Selections" in the menu. When at the Stock
Selections page, click on a stock's symbol to bring-up an archive of
our comments on the stock in question. 2) The Small Stock Watch List is
located at http://www.speculative-investor.com/new/smallstockwatch.html
Chart Sources
Charts appearing in today's commentary
are courtesy of:
http://stockcharts.com/index.html
http://www.barchart.com/

|

