![]()
![]()
![]()
![]()
- Interim Update 7th October 2015
Copyright
Reminder
The commentaries that appear at TSI
may not be distributed, in full or in part, without our written permission.
In particular, please note that the posting of extracts from TSI commentaries
at other web sites or providing links to TSI commentaries at other web
sites (for example, at discussion boards) without our written permission
is prohibited.
We reserve the right to immediately
terminate the subscription of any TSI subscriber who distributes the TSI
commentaries without our written permission.
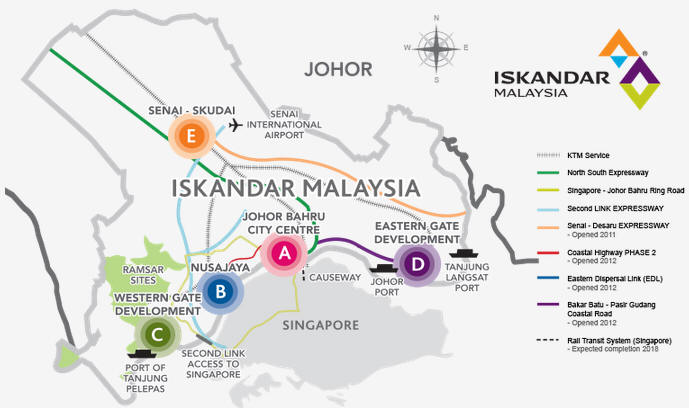
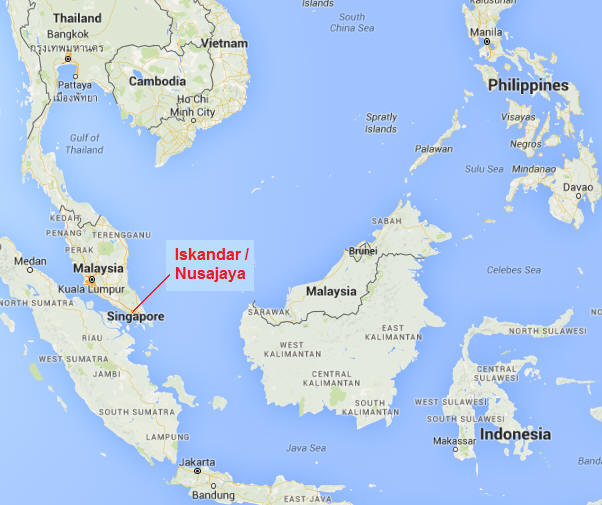
Nusajaya
Nusajaya is the name of a city
located within Iskandar, a special economic region in the state of Johor,
Malaysia. A plan of Iskandar and a map showing its position relative to other
parts of SE Asia are displayed below. Also, a 4-minute promotional video about
Iskandar can be viewed
HERE.
In a nutshell, Nusajaya is a new Malaysian development located only a stone's
throw from Singapore. Actually, it's about a 20-minute drive from Nusajaya to
the outskirts of Singapore and about a 40-minute drive from Nusajaya to the
centre of Singapore. Travelling between Singapore and Nusajaya (or some other
parts of Iskandar) is quick enough and easy enough that many Singaporeans now
live in Nusajaya and commute to Singapore for work every day. Also, there are
plenty of school students who live in Singapore and attend the Nusajaya-located
Marlborough College
Malaysia (the first international branch of Marlborough College UK).
I, my wife and my son spent last week in Nusajaya. We went there for three
reasons, the first of which was to check out the aforementioned Marlborough
College and, if it looked good, to submit an application for my son to go there
for his final two years of high school (called "6th Form" under the UK system).
Marlborough is expensive, but it seems that you get what you pay for. We were
very impressed, so our son will be entering "Lower 6th" at Marlborough next
September.
The second reason, which is related to the first reason, was to ascertain
whether Nusajaya would be a good place for us to live. We therefore wanted to
check out the overall environment and the different housing options/locations.
Thanks to the raging forest fires in Sumatra (Indonesia) that have affected
large swaths of SE Asia, we definitely didn't see Nusajaya in its best light.
Jimmy Buffett might have "spent
four lonely days in a brown L.A. haze", but we spent six days in a grey
Sumatra haze. The air was reminiscent of our time in Shanghai.
Despite the "haze", we came away thinking that Nusajaya would be an OK place to
live. My wife liked it more than I did. For me, moving to Nusajaya would be a
step in the wrong direction considering the lifestyle we have in Kota Kinabalu,
but she was attracted by the close proximity of the major shopping centres of
Singapore and Johor Bahru.
The third reason for the trip was to find out whether it would make sense to buy
a house or condo in Nusajaya as an investment. Residential property in Nusajaya
is not cheap, but property prices are much lower than in nearby Singapore and
will possibly rise as Singaporeans migrate in search of more spacious and
lower-cost accommodation. Also worth taking into account is that the convenience
of Nusajaya and the surrounding area will get another boost in the future from
the development of a fast rail system linking Singapore and Kuala Lumpur (KL).
This rail link, which is currently scheduled to be complete in 2022, will have a
stop in Nusajaya.
It seems that Nusajaya's property market topped about two years ago. In Ringgit
terms prices have tapered off about 10% since then, but, due to the large
decline in the Ringgit relative to the US$, in US$ terms residential property
prices are now about 40% lower. Therefore, two years ago would definitely have
been a bad time to buy. The question I'm wrestling with is whether there is
worthwhile upside potential from here relative to the remaining downside risk.
I suspect the answer is yes, but only for the right property in the right
location. My guess is that in US$ terms the median price will be flat at best
over the next two years. At the same time, there's a significant risk of a
further double-digit decline. The reason is the huge amount of new supply set to
come onto the market over the next few years.
In Nusajaya there are a lot of unfinished housing estates and condominium
developments, and there are many new developments in the planning stage. The
city is very much a work-in-progress. Therefore, even with the steady stream of
migrants from Singapore it's likely that residential property in Nusajaya will
remain a buyers' market for a few more years and that only the properties that
are in much-sought-after locations with very limited capacity for new
construction will turn out to be good investments.
The above statement probably applies to much of the world, as the last remaining
real-estate bubbles deflate and high debt levels (hangovers of earlier bubbles)
preclude new broad-based real-estate booms. Gone, for now, are the days when you
could buy any old house in any old location and be almost certain to make a
sizable real return every year. Over the next few years it's probable that a
good real-estate investment will be one that manages to cover its costs.
The bottom line is that we'll be relocating from the tropical paradise of Kota
Kinabalu to the less-paradisiacal, but still OK, Nusajaya next year. As to
whether we buy real-estate in Nusajaya, the jury is still out.
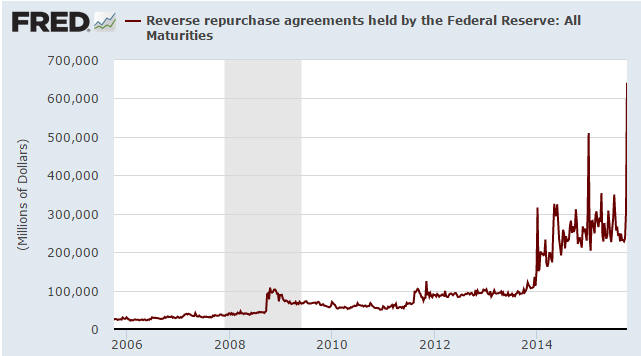
Reverse Repo
Scare-Mongering
We've seen some excited
commentary about the recent rise in the dollar volume of Reverse Repurchase (RRP)
operations conducted by the Fed. Here's a chart showing the increase in RRPs
over the past few years and the dramatic spike that occurred during the final
week of September (the latest week covered by the chart).
For the uninitiated, a reverse repurchase agreement is an open market operation
in which the Fed sells a Treasury security to an eligible RRP counterparty with
an agreement to repurchase that same security at a specified price at a specific
time in the future. The difference between the sale price and the repurchase
price, together with the length of time between the sale and purchase, implies a
rate of interest paid by the Fed on the cash invested by the RRP counterparty.
In short, it is a cash loan to the Fed that is collateralised by some of the
Fed's Treasury securities. The Fed receives some cash, the RRP counterparty
receives some securities. Note that the Fed never actually needs to borrow
money, but it sometimes does so as part of its efforts to control interest rates
and money supply.
As mentioned above, the recent large spike in RRPs has caused some excitement.
For example, some commentators have speculated that it signals an effort by the
Fed to paper-over a major derivative blow-up. As is often the case in such
matters, there are less entertaining but more plausible explanations.
We don't pretend to know the exact reason(s) for the RRP spike, but here are
some points that, taken together, go a long way towards explaining it:
1) The Fed recently enabled a much larger range of counterparties to participate
in RRPs. Previously it was just primary dealers, but eligible participants now
include GSEs, banks and money-market funds.
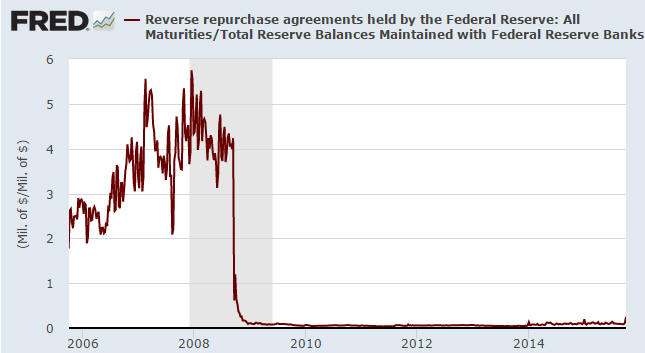
2) Reverse Repos involve a reduction in bank reserves, which means that the
volume of RRPs is limited to some extent by the volume of reserves held at the
Fed. Eight years ago the total volume of reserves at the Fed was almost zero,
whereas today it is well over $2T. It could therefore make sense to consider the
volume of RRPs relative to the volume of bank reserves.
The following chart does exactly that (it shows RRPs relative to total bank
reserves at the Fed). Viewed in this way, the recent spike is a lot less
dramatic.
3) Prior to this year RRPs were overnight transactions, but in March of 2015 the
FOMC approved a resolution authorizing "Term RRP Operations" that span each
quarter-end through January 29, 2016. The Fed has recently been ramping up its
Term RRP Operations as part of an experiment related to 'normalising' monetary
policy.
4) A reverse repo involves the participants parting with the most liquid of
assets (cash) for a slightly less liquid asset (Treasury securities), so RRPs
are NOT conducted with the aim of boosting financial-system 'liquidity'. They
actually remove liquidity from the financial system.
5) A corollary to point 4) is that because RRPs involve the temporary REMOVAL of
money from the financial system, the Fed cannot possibly bail-out or support a
bank (or the banking industry as a whole) via RRPs. In effect, a reverse repo is
a form of monetary tightening. It is the opposite of "QE".
6) The recent large increase in the volume of RRPs could be partly due to a
temporary shortage of Treasury securities -- a shortage that the Fed helped
create via its QE and that the US Federal Government has exacerbated by reducing
the supply of new securities in response to the closeness of its official "debt
ceiling". That is, the Fed could be using RRPs to alleviate a temporary shortage
of government debt securities. However, we suspect that interest-rate arbitrage
is playing a larger role, because the RRP participants are getting paid an
interest rate that in today's zero-interest world could look attractive.
7) Lending money to the Fed is the safest way to temporarily park large amounts
of cash.
The Stock Market
The US
On Wednesday the S&P500 Index (SPX) tested resistance at 2000. There is actually
a confluence of resistance near this level, including the 50-day MA. It is
therefore a likely level for a 1-2 week peak.
Although the odds favour a pullback, we don't think that a new short-term
bearish speculation is warranted at this time. The reason is that more evidence
emerged during the first half of this week that the August low has been
successfully tested and will not be revisited anytime soon. We are referring to
the collapse in the number of individual stocks making new 52-week lows on both
the NYSE and the NASDAQ.
The right time to enter a new short-term bearish speculation will probably be
after the SPX rises to the vicinity of its 200-day MA (the 2050s), but we'll
cross that bridge when we come to it.
Gold and the Dollar
Gold
The US$ gold price has risen to the top of its declining-tops pattern, which
also happens to be the top of a channel. This is a likely place for some
corrective activity to begin.
Gold needs a weekly close above $1180 to confirm an intermediate-term reversal,
but a daily close above $1156 would probably be enough to give the gold-mining
sector another significant boost.
Regarding silver, about three weeks ago we wrote:
"If gold continues to rally over the weeks ahead then silver will also rally.
By the same token, if gold doesn't rally over the weeks ahead then neither will
silver. In other words, regardless of any anecdotal evidence of silver shortages
at coin shops, silver's short-term price trend will be determined by gold's
short-term price trend. Furthermore, if the gold price rises then the silver
price will probably rise by a greater percentage, the reason being that the
silver/gold ratio is close to a multi-decade low (implying: silver is very cheap
relative to gold)."
Gold has rallied and, not surprisingly, silver has rallied by a greater
percentage.
Silver is now 'overbought' on a short-term basis and has reached resistance
defined by its 200-day MA. Anyone wanting to buy should wait for a pullback.
Gold Stocks
In the email sent to subscribers after Tuesday's trading session, we wrote that:
a) Additional evidence of a multi-month bottom in the gold-mining sector was
generated on Monday when the HUI/gold ratio closed decisively above its 40-day
MA for the first time since April.
b) Still more evidence of a multi-month bottom was provided on Tuesday when the
HUI rose for a third consecutive trading day. The third consecutive daily
advance was important because when the gold-mining indices are experiencing
counter-trend bounces within short-term downward trends, consecutive daily
advances typically don't extend beyond two.
c) Having just provided clear evidence of a short-term trend reversal it would
not be surprising if the HUI now experienced a 1-2 day pullback.
As it turned out, the HUI managed a small gain on Wednesday and has therefore
extended its daily winning streak to four. However, GDX and GDXJ were slightly
lower, so it is probably fair to view Wednesday as a consolidation day. We doubt
that there will be anything more than a minor correction between now and when
the rally resumes.
Our short-term target for the gold-mining recovery that got underway in earnest
over the past week is the 200-day MA. For the HUI, this means the 150s. For GDX,
this means $17.50-$18.00. For GDXJ, this means $23.50-$24.00. Also worth noting
is that as well as being a plausible objective for the current short-term rally,
the area around the 200-day MA defines the MAXIMUM realistic short-term upside
potential. Even if a new bull market has begun it is not reasonable to expect
the initial rally to do significantly more than take the price back to the
200-day MA.
The recent strong rebound in the gold-mining sector is obviously due in part to
price gains in the bullion market, but a general recovery in commodity-related
equities is also helping. Take, for example, the following daily chart of the
Diversified Metals and Mining Index (SPTMN). SPTMN's bounce over the past week
can aptly be described as dramatic.
During the final week of September we noted the depressing effect of SPTMN's
collapse on gold-mining-related sentiment. Prior to this week, SPTMN had fallen
on 19 out of 22 weeks. It was sufficiently 'oversold' to end the bear market or
at least to set the stage for an intermediate-term rally.
Recall that we have two scenarios in mind for what will likely happen to
equities over the coming year. The first, which is the one that currently has
the edge, entails a general equity bear-market unfolding in fits and starts. The
second entails an extension of the post-2009 cyclical bull market with a
rotation towards commodity-related plays. The gold-mining sector would probably
benefit from either of these scenarios.
Regardless of which intermediate-term stock-market scenario is closest to
reality, the general mining universe has probably bottomed for 2015 and will be
a good candidate for new buying following a significant pullback, where a
"significant" pullback is one that retraces about half of the preceding sharp
rise. Assuming we get the aforementioned pullback, COPX (the Global X Copper
Miners ETF) will be a reasonable way to gain exposure to the general recovery in
mining stocks.
The Currency Market
The Yen wasn't helped as much as expected by stock market weakness during the
second half of September and surprisingly hasn't been hurt by the sharp rebound
in stock prices over the past several days. Instead, it has now spent about six
weeks oscillating within a narrow horizontal range.
We think it makes sense to give the short-term bullish case the benefit of the
doubt, as the price action of the past six weeks looks more like a mid-trend
consolidation than a reversal pattern. Note, however, that this view would be
invalidated by a daily close below 82.5.
Updates on Stock Selections
Notes: 1) To review the complete list of current TSI stock selections, logon at
http://www.speculative-investor.com/new/market_logon.asp
and then click on "Stock Selections" in the menu. When at the Stock
Selections page, click on a stock's symbol to bring-up an archive of
our comments on the stock in question. 2) The Small Stock Watch List is
located at http://www.speculative-investor.com/new/smallstockwatch.html
Chart Sources
Charts appearing in today's commentary
are courtesy of:
http://stockcharts.com/index.html
http://research.stlouisfed.org/
![]()