|
- Interim Update
8th January 2014
Copyright
Reminder
The commentaries that appear at TSI
may not be distributed, in full or in part, without our written permission.
In particular, please note that the posting of extracts from TSI commentaries
at other web sites or providing links to TSI commentaries at other web
sites (for example, at discussion boards) without our written permission
is prohibited.
We reserve the right to immediately
terminate the subscription of any TSI subscriber who distributes the TSI
commentaries without our written permission.
The Stock Market
The potential for a change in leadership
The Baltic Dry Index (BDI), an index of international ocean-going shipping
rates, peaked at around 12000 during the second quarter of 2008. It then
collapsed in spectacular fashion to less than 1000 by the final quarter of 2008
in response to the global financial crisis and recession. The crisis abated and
the BDI rebounded to around 4000, but by 2012 it had dropped back to the
vicinity of its 2008 low. After chopping around near its 2008 low during 2012
and the first half of 2013, it has since moved up to around 2000. What do we
make of this?
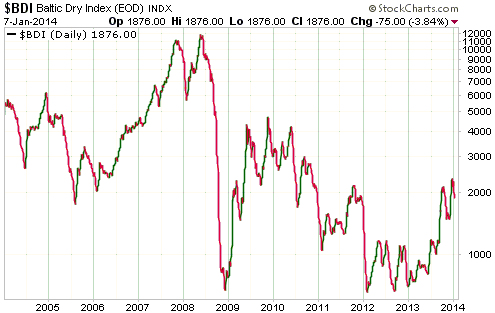
Up until a few years ago we used the BDI as an indicator of global trade and US$
turning points, but by early 2011 it had become apparent to us that the BDI's
trends were being determined to a far greater extent by changes in the supply of
ships than changes in the volume of trade. What happened was that a lot of new
ships were built in reaction to the high shipping rates of 2007-2008. When this
new supply came on line during 2009-2011 it cut short the rebound in shipping
rates that was underway and caused the BDI to drop back to its 10-year low
despite a recovery in global demand. The low rates rendered all but the newest
and most efficient freight carriers unprofitable, leading to many old ships
being scrapped and addressing the over-supply problem.
At this time we suspect that the BDI's rebound over the past 6 months has more
to do with the scrapping of old ships and the consequent reduction in shipping
supply than a significant increase in global trade, but it's certainly possible
that there will be a demand-driven surge in the BDI if the inflation-fueled boom
of the past two years lasts another 12 months. That's a big 'if' that relies on
a) the US stock market experiencing nothing more negative than a 10% correction,
b) the euro-zone banking system remaining crisis-free, and c) China's economy
maintaining the outward appearance of strong growth. However, it is an
intermediate-term possibility worth considering.
If the inflation-fueled boom and the associated stock market rally last another
12 months or so then there could be a change in stock market leadership, with
basic materials and commodity-related stocks taking over the leading role.
Whether this leadership change happens in the stock market (under the continuing
boom scenario) will largely be determined by the currency market. Specifically,
a continuing stock market up-trend in parallel with US$ strength would probably
be accompanied by additional upward acceleration in the types of stocks that led
the way last year, whereas a continuing stock market up-trend in parallel with
US$ weakness would probably be accompanied by a shift in leadership that
favoured commodity-related equities (including gold-mining stocks). The former
possibility would be akin to 1999-2000 and the latter possibility would be akin
to the 12-month period prior to the 1987 stock market crash.
Note that neither of the aforementioned possibilities have high probabilities.
In our opinion, the US stock market is either topping on an intermediate-term
basis right now or will do so during April-May in synch with the Presidential
Cycle Model. However, a 12-month continuation of the inflation-fueled boom
cannot be ruled out, especially with monetary conditions remaining 'easy' in the
major economies.
Current Market Situation
Further to the discussion above, we'll now take a look at how a change in
leadership would be signaled.
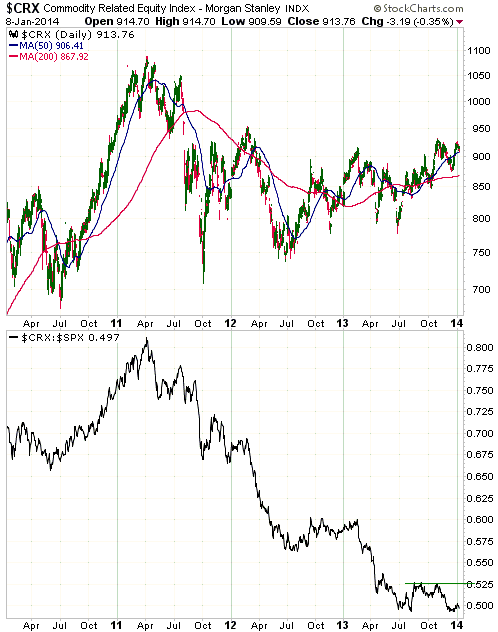
The following daily chart shows the Commodity-Related Equity Index (CRX) and the
CRX/SPX ratio. The chart shows that in nominal dollar terms the CRX has
essentially traded sideways over the past few years, but that relative to the
SPX (S&P500 Index) the CRX has been in a downward trend (a cyclical bear market,
actually) and is presently near its 4-year low.
A daily close by CRX/SPX above its October-2013 high would indicate that CRX was
becoming a relative strength leader.
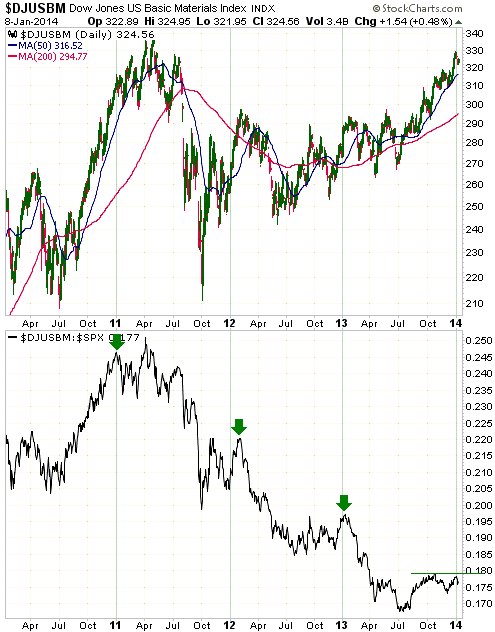
The next chart shows the Basic Materials Index (DJUSBM) and the DJUSBM/SPX
ratio. This chart is similar to the CRX chart above, except that DJUSBM has been
considerably stronger than CRX over the past 6 months.
As is the case with CRX and the CRX/SPX ratio, a daily close by DJUSBM/SPX above
its October-2013 high would indicate that DJUSBM was becoming a relative
strength leader. The difference is that DJUSBM is much closer than CRX to
confirming a trend change. Note, however, that during each of the past few years
the DJUSBM/SPX ratio has reached an important peak near the beginning of the
year (these peaks are identified by the green arrows on our chart).
The final chart shows the Emerging Market Equity ETF (EEM) and the EEM/SPX
ratio. The multi-year downward trends in EEM/SPX and CRX/SPX appear to be
linked, but EEM/SPX is a lot further from signaling a trend reversal. In fact,
it broke out to the downside over the past two weeks and has just made a new
4-year low.
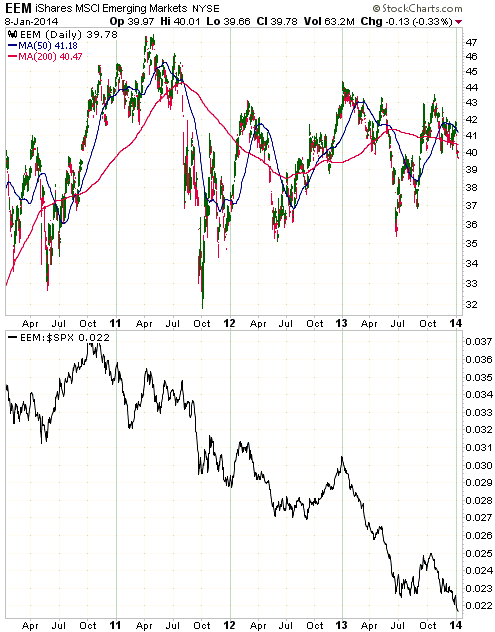
Over the past 6 years a lot of people were bullish on the emerging markets for
the wrong reasons. They thought that the strong growth was sustainable, rather
than an effect of monetary inflation that would quickly evaporate after obvious
evidence of a "price inflation" problem forced central banks to tighten monetary
conditions.
The economic fundamentals of many emerging markets, including Brazil, China and
India, have been bearish for many years and remain so today. But that doesn't
mean that the downward trend in EEM/SPX won't end over the next few months,
because at some point in a price trend the fundamentals become fully discounted.
However, it does suggest to us that commodity-related equities will generally be
a safer bet than emerging-market equities in 2014.
Gold and the Dollar
Gold
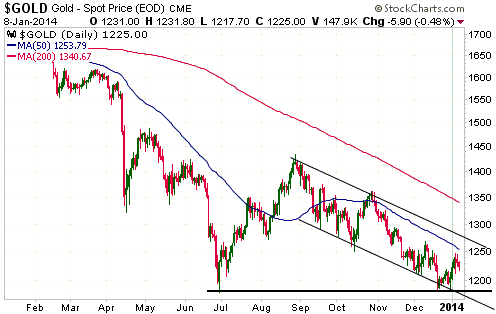
We are patiently waiting for the gold market to exhibit enough strength to
signal a trend reversal. There will be doubt as to whether gold has reversed
upward on a sustainable basis until after the gold price moves well above $1300,
but a daily close above $1268 (down from the previously advised $1275) would now
be enough to shift our short-term outlook to "bullish". $1268 is slightly above
the December-2013 high.
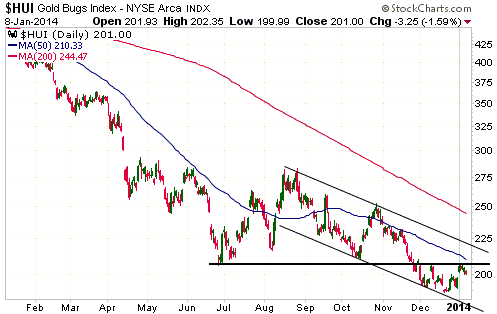
Our short-term gold outlook will also shift to "bullish" if the HUI closes above
207, as a confirmed reversal in the gold-mining sector of the stock market would
indicate that a similar signal was on the way in the bullion market.
Gold Stocks
The HUI is unfortunately taking its time to confirm an upward trend reversal.
The more time that elapses without confirmation of an upward reversal, the
higher the probability that there will be a spike to another new multi-year low
before a major bottom is put in place.
To remove almost all doubt as to whether the gold-mining sector has reversed
upward, the HUI will have to clearly break above the top of the channel drawn on
the following daily chart. However and as previously advised, a daily close
above resistance at 207 would be enough evidence of a reversal to shift our
short-term gold-stock outlook to "bullish".
Currency Market Update
The Euro and the Dollar Index
Euro sentiment, momentum and price action are neutral. However, we turned
short-term bullish on the Dollar Index and, by extension, short-term bearish on
the euro on 11th December due to evidence that European bank stocks (represented
by the EURO STOXX Banks Index - SX7E) were rolling over to the downside and
strength in large-cap US equities relative to large-cap European equities.
Although our short-term currency market outlook was recently substantiated by
the Dollar Index's break above the top of a downward-sloping channel, the
inter-market relationships that originally prompted the positive shift in our
US$ outlook are no longer US$-bullish. The following charts show what we mean.
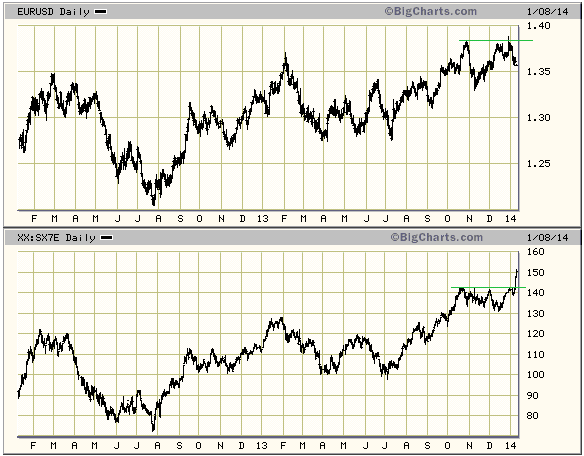
The first chart compares the euro/US$ rate with the SX7E. Notice that a) the
euro's exchange rate has trended in the same direction as the SX7E over the past
two years, b) the SX7E began to drift downward in mid-October and made a 2-month
low in mid-December, and c) the SX7E reversed course during the second half of
December and broke decisively to a new multi-year high over the past two trading
days (this week's upside breakout by the SX7E was a reaction to news that a new
set of EU banking rules will be less stringent than previously expected). SX7E's
move to a new 2-year high suggests that the euro will soon do the same.
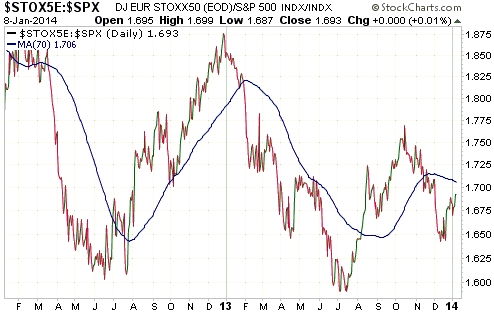
The second chart shows the STOX5E/SPX ratio, an indicator of large-cap European
stocks relative to large-cap US stocks. This ratio trended lower from
mid-October through to mid-December, indicating relative weakness in European
equities and putting downward pressure on the euro. It has since turned higher,
but at this stage there is no way of telling if the up-turn is a meaningful
trend reversal or just a counter-trend reaction (a correction to an on-going
downward trend).
A move above the 70-day MA (the blue line on the chart) would clearly skew the
odds in favour of a meaningful trend reversal. This is simply because the 70-day
MA has done a reasonable job of defining the trend over the past few years.
For now, we remain short-term bullish on the Dollar Index in recognition of its
recent upside breakout.
The Canadian Dollar (C$)
Like the A$, the C$ completed a long-term topping pattern during the second
quarter of last year.
The C$ fell sharply over the past two trading days, in the process breaking
below the bottom of a 4-week consolidation and hitting a new 3-year low. As far
as we can tell, the catalyst for this week's C$ plunge was evidence that unlike
the US Fed, which will be gradually reducing the level of its 'monetary
accommodation' over the next several months, the Bank of Canada has probably not
yet reached the end of its easing cycle.
We expect that the C$ will decline to 85 or lower before its bear market is
over. However, we have no opinion on what it will do over the next few weeks. It
could continue to decline, but at some point there will be a short-covering
rally that takes the currency up to the vicinity of its 200-day moving average
(the blue line on the following chart).

Update
on Stock Selections
Notes: 1) To review the complete list of current TSI stock selections, logon at
http://www.speculative-investor.com/new/market_logon.asp
and then click on "Stock Selections" in the menu. When at the Stock
Selections page, click on a stock's symbol to bring-up an archive of
our comments on the stock in question. 2) The Small Stock Watch List is
located at http://www.speculative-investor.com/new/smallstockwatch.html
Chart Sources
Charts appearing in today's commentary
are courtesy of:
http://stockcharts.com/index.html
http://bigcharts.marketwatch.com/

|
