![]()
![]()
![]()
![]()
- Interim Update 8th February 2017
Copyright
Reminder
The commentaries that appear at TSI
may not be distributed, in full or in part, without our written permission.
In particular, please note that the posting of extracts from TSI commentaries
at other web sites or providing links to TSI commentaries at other web
sites (for example, at discussion boards) without our written permission
is prohibited.
We reserve the right to immediately
terminate the subscription of any TSI subscriber who distributes the TSI
commentaries without our written permission.
About the banks
In response to the 2007-2009
financial crisis, policy-makers in the US who had absolutely no idea what
caused the crisis enacted legislation that would supposedly prevent such a
crisis from re-occurring. The legislation is called "The Wall Street
Reform and Consumer Protection Act", although it is better known as
"Dodd-Frank". Unsurprisingly, considering its origins, the Dodd-Frank
legislation has done nothing to reduce financial-crisis risk but has made
the economy less efficient. Quite rightly, therefore, the Trump
Administration is intent on repealing all or parts of it. What are the
likely consequences?
If Dodd-Frank were scaled back in a meaningful
way it could make interactions between customers and their banks more
efficient, but without knowing exactly which parts of the legislation are
going and which parts are staying it isn't possible to quantify the
consequences. For example, a part of the legislation that will probably go
is the requirement for banks to retain at least 5% of any loans they
securitise. Eliminating this requirement would be slightly helpful to
banks, but would make very little difference to the overall economy.
What we can say is that the efficiency-related benefits of
meaningfully scaling back Dodd-Frank would be long-term.
As an
aside, it's worth mentioning that there is a risk associated with scaling
back the economy-hampering legislation known as Dodd-Frank. The risk is
that when the next crisis occurs, de-regulation will get the blame and the
Federal Reserve, the primary agent of economic instability, will again get
away untarnished and more powerful than ever.
With regard to
economic performance over the next year or so, changes in the pace at
which US banks collectively expand credit will likely be of far greater
importance than changes in how the US banking industry is regulated. From
a practical investing/speculating standpoint it therefore makes more sense
to focus on the following chart than on the latest Dodd-Frank news.
The chart shows that after oscillating in the 7%-8% range for about 2
years, the year-over-year (YOY) rate of credit growth in the US banking
industry has slowed markedly of late. As recently as October it was above
8%, but it's now around 5.8%.
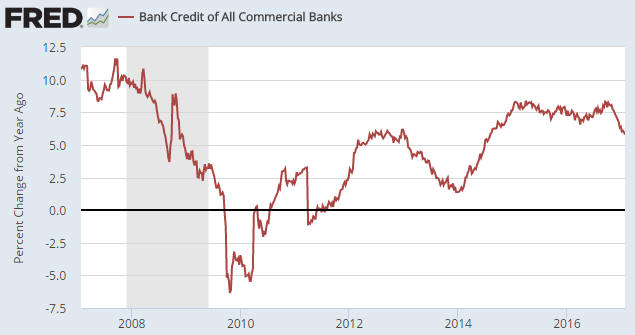
The steep decline in the rate of bank credit growth during 2013 didn't
have any dramatic economic consequences, but that's because the Fed was
rapidly expanding credit via its QE program at the time. With the Fed no
longer directly adding credit and money to the financial system, keeping
the credit-fueled boom alive now depends on the commercial banks. In
particular, there's little doubt that a further significant decline in the
rate of commercial-bank credit growth would have a noticeable effect on
the economy. On a long-term basis the effect would actually be positive,
but on an intermediate-term basis it would be very negative because many
activities and asset prices are now supported by nothing other than the
creation of credit and money out of 'thin air'.
The T-Bond rally has
resumed
Long-dated Treasury securities,
as represented on the following chart by TLT (the 20+ Year Treasury ETF),
have resumed their rally. As advised in the 9th January Weekly Update, we
have $128-$130 in mind as a short-term upside target range for TLT.
A rally to $128-$130 in TLT would probably be associated with a dip
below 2% in the 10-year T-Note yield.
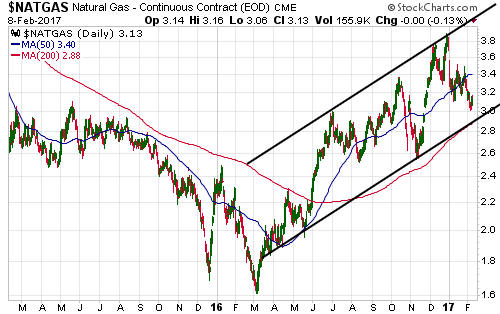
Natural Gas (NG)
remains in correction mode
We are short-term and
intermediate-term bullish on natural gas, but our short-term bullish
outlook is being called into question by the price action.
So far,
NG's pullback from its late-December peak is within the bounds of a
routine correction. However, the price can't fall much further without
indicating that a more serious decline is in progress. Specifically, a
daily close below $2.90 would breach a confluence of support and confirm
that the December peak was more important than we thought at the time. By
the same token, as long as the price holds above $2.90 on a daily closing
basis it will be reasonable to view the price action since the December
peak as a normal correction within an on-going rally.
Money Management
Note
The approach that we use in the management of our equity portfolio
involves scaling into positions on weakness and scaling out on strength.
This approach treats the buying and selling of a stock as an analog
process as opposed to a digital event, thus circumventing the need to
consistently get the timing right. There are, however, many nuances, one
of which is that when determining bid prices the stinginess of our bid
will in most cases be directly proportional to the size of our existing
position. The more money we already have at risk in a particular stock,
the lower the price at which we will be prepared to place a new buy order
for the stock.
One consequence is that our level of stinginess
will generally be lowest, that is, our willingness to pay-up will
generally be highest, when making the initial purchase. To further
explain, after we've decided that a stock offers enough valuation-related
upside potential relative to the downside risk to be worth owning, we will
often take an initial position even if the stock appears to be a little
'overbought' and vulnerable to a pullback. This is a way of managing the
risk that the stock price will move a lot higher before embarking on a
correction.
Another consequence is that after we have almost
reached our planned maximum exposure to a particular stock, the stock will
probably have to become very 'oversold' before we do any additional
buying.
Something similar applies during the scaling-out (selling)
process. In this case, the amount of price strength needed to encourage a
partial sale will usually be inversely proportional to the size of our
existing position. All else being equal, the more money we have at risk in
a particular stock the lower the price at which we will be willing to
'take some money off the table'.
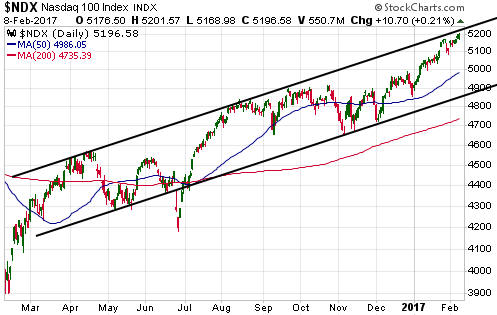
The Stock Market
The US
The NASDAQ100 Index (NDX) has extended its post-election rally and is now
very close to the top of the channel that limited its longer-term advance
over the past 12 months. With reference to the chart displayed below,
notice that the moves to the channel top in April and August of last year
were followed by 2-3 month corrections that took the price down at least
as far as the channel bottom.
The most likely outcome is that the
channel top will, again, limit the advance, but there is always more than
one plausible outcome. In this case, be aware that there is a realistic
chance of an upside blow-off (upward acceleration involving a break above
the channel top) within the coming 2 months.
As often happens, the US stock indices are not all in synch with each
other at this time. For example, while the NDX has moved relentlessly
higher over the past 2 months and is now stretched to the upside on both a
short-term basis and an intermediate-term basis, over the same 2-month
period the Russell2000 SmallCap Index (RUT) has traded sideways with a
slight downward bias.
RUT's recent downward drift could be a
topping pattern, but it could also be a bullish consolidation -- a natural
short-term reaction to the post-election moonshot.
RUT's extreme
strength during the weeks following Trump's election victory was
anticipated by nobody and yet can be explained by everybody with the
benefit of hindsight.
Gold and the Dollar
Gold
The
US$ gold price broke above short-term resistance at $1220 during the first
three days of this week and is well on its way to the 200-day MA in the
$1260s. In fact, on Wednesday 8th February it got to within $20 of its
200-day MA and therefore got to within $20 of the upside target we've had
in mind for the rally that began in the $1120s in December.
Regardless of whether or not it first spikes up the vicinity of the
200-day MA, the gold market is now 'overbought' on a short-term basis and
likely to reach some sort of peak within the next few days.
The
peak could be the sort that holds for many months and is followed by a
decline that retraces the December-February rally in full, especially if
it is preceded by a spike up to the 200-day MA. Alternatively, it could be
the sort that ushers-in nothing more bearish than a routine 2-4 week
pullback. Unfortunately, there's no way of knowing at this time (although
that won't prevent many commentators from claiming to know).
In
favour of the more-bullish of the above-mentioned possibilities is that
the fundamental backdrop has been improving (from gold's perspective) with
the price. This can be most easily seen by looking at the performance of
the bond/dollar ratio (the T-Bond price divided by the Dollar Index),
which directly or indirectly takes into account most of gold's fundamental
price drivers.
As illustrated by the following chart, the
bond/dollar ratio turned downward at almost exactly the same time as the
gold price in early-July of last year and then turned upward at almost
exactly the same time as the gold price in the second half of December. On
Wednesday of this week it made a new high for the year, thus validating
the move in the gold price.
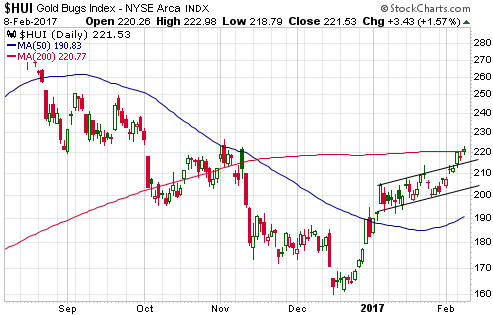
Gold Stocks
The HUI has followed in GDXJ's
footsteps and ended its month-long consolidation via an upside breakout.
It is now at the bottom of our 220-250 target range for the rally that got
underway in December.
A rise to near the top of this range within
the next 2 months -- with an intervening correction -- is a
better-than-even-money bet, but keep in mind that as the price goes higher
so does the downside risk. In particular, although everyone with sizable
exposure to gold-mining stocks feels a lot more comfortable now than they
did in December, the short-term risk/reward for new buying is now
significantly worse.
Even though the HUI has only just broken out
to the upside, the intervening correction mentioned above will probably
begin within the next few days.
The Currency Market
We've had the low-90s in
mind as a short-term upside target for the Yen. It is now within a couple
of points of this target.
The Yen is the major currency with the strongest positive correlation
to the US$ gold price. Consequently, our interest is always piqued when
there is a divergence between gold and the Yen.
Currently there is
no divergence, in that the new year-to-date high achieved by gold this
week was accompanied by a new year-to-date high in the Yen. However, a
divergence or non-confirmation will potentially occur over the days/weeks
ahead, with one making a new high for the year while the other makes a
lower high. If this happens it will be a warning that a short-term top is
near for both markets.
Updates on Stock Selections
Notes: 1) To review the complete list of current TSI stock selections, logon at
http://www.speculative-investor.com/new/market_logon.asp
and then click on "Stock Selections" in the menu. When at the Stock
Selections page, click on a stock's symbol to bring-up an archive of
our comments on the stock in question. 2) The Small Stock Watch List is
located at http://www.speculative-investor.com/new/smallstockwatch.html
Chart Sources
Charts appearing in today's commentary
are courtesy of:
http://stockcharts.com/index.html
http://research.stlouisfed.org/
![]()