|
- Interim Update 8th March 2006
Copyright
Reminder
The commentaries that appear at TSI
may not be distributed, in full or in part, without our written permission.
In particular, please note that the posting of extracts from TSI commentaries
at other web sites or providing links to TSI commentaries at other web
sites (for example, at discussion boards) without our written permission
is prohibited.
We reserve the right to immediately
terminate the subscription of any TSI subscriber who distributes the TSI
commentaries without our written permission.
The long-term dollar bear
...events will once again conspire to eliminate the inflation-rate and
interest-rate advantages that are the basis of the dollar's current
upward trend. ...It is very unlikely, however, that the US$ will ever
COLLAPSE in value relative to any other fiat currency.
Over the past two years the US$ inflation rate has been less than the
inflation rates of the euro, the Pound, the Australian Dollar and the
Canadian Dollar. This inflation rate advantage, combined with the
dollar's interest rate advantage over most of its major competitors in
the fiat currency world, has been the driving force behind a bull
market in the Dollar Index that is presently 14 months old and is
likely to last for at least another 6 months. We continue to believe,
however, that this bull market is a counter-trend move within the
context of a longer-term downward trend (a cyclical bull within a
secular bear). Our reasoning is outlined below.
Although the US$ has experienced relatively less inflation over the
past two years, between 1998 and 2003 there was a lot more inflation
(money-supply growth) in the US than there was, for example, in the
major economies of Europe. This made the dollar over-valued and thus
set the stage for the long-term dollar bear market that began in 2001.
Also, the US stock market was the focal point of the global boom in
technology, telecom and internet stocks, so when the NASDAQ bubble
burst in March of 2000 the US lost something that had been acting as a
magnet for foreign investment; that is, it lost something that had been
boosting the demand for the dollar.
It's important to note, though, that it wasn't until some time after
the Fed had cut US interest rates aggressively in response to the 2001
recession, the 9/11 terrorist attacks and the plunge in capital
spending that followed the bursting of the NASDAQ bubble that US$
supply began to overwhelm US$ demand and the Dollar Index began to
trend lower in earnest. In other words, things happened during
2000-2001 that forced the Fed to adopt an ultra-easy monetary policy
and it was this change in monetary policy (and the resultant inflation)
that caused the dollar to weaken.
Our view is that events will once again conspire to eliminate the
inflation-rate and interest-rate advantages that are the basis of the
dollar's current upward trend. In particular, the huge costs of
maintaining a military presence in the Middle East and re-building New
Orleans, combined with the lack of any real desire to cut spending in
other areas or raise taxes, all but guarantee a continuation of the
current rapid pace at which the US Federal Government borrows dollars
into existence. Furthermore, the Fed will again adopt an aggressive
pro-inflation stance once the stock and commodity markets begin to
trend lower with conviction and the economic data starts pointing
towards a recession. As was the case during 2001-2004, large-scale
deficit-spending by the US Government in combination with rate cuts by
the Fed should catalyse another multi-year decline in the US$.
So, we expect that the main drivers of relative currency valuations --
inflation rates and interest rates -- will begin to pressure the dollar
lower at some point during the second half of this year. It is very
unlikely, however, that the US$ will ever COLLAPSE in value relative to
any other fiat currency. The reason is that ALL of these currencies are
in the process of being inflated into oblivion; it's just that over the
next few years the dollar is likely to move towards that ultimate
destination at a modestly faster pace than some of the other major
currencies.
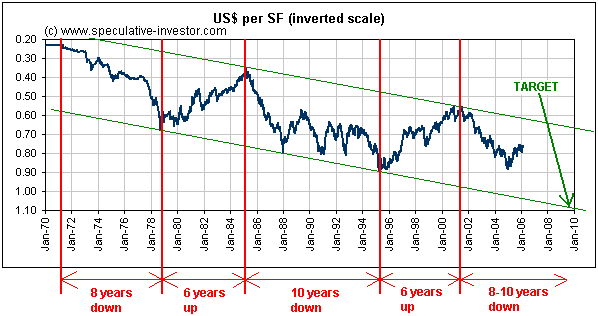
The dollar's orderly long-term decline against the Swiss Franc is
illustrated by the following chart. Notice that the dollar has made a
succession of lower highs and lower lows since 1970 and that there has
never been a runaway bull or bear market. Rather, steady declines
lasting 8-10 years have been punctuated by steady advances lasting 6
years. If this pattern continues then the next bottom will occur near
the end of this decade with US$ and the Swiss Franc at close to parity.
If the dollar's decline ever did become disorderly, that is, if the
dollar began to fall at an accelerated pace, then the central banks of
the US's main trading partners could be relied upon to stem the decline
by taking steps to weaken their own currencies. One thing you should
never bet against is the ability of a central bank to devalue its
currency. This is because someone with the power to create an unlimited
supply of some 'thing' definitely has the power to lower the thing's
value if they choose to do so.
Bonds
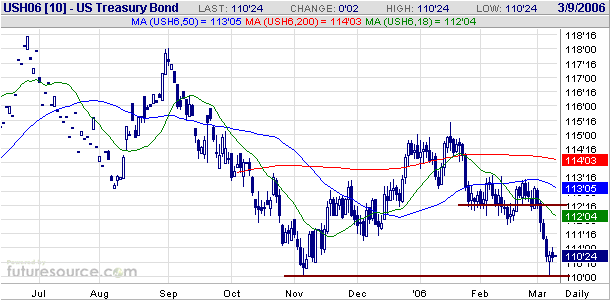
Although the 10-year Treasury Note has recently broken below all
support levels that have formed over the past three years, the
longer-dated Treasury Bond is still hanging in there. The following
daily chart of March T-Bond futures shows that last November's low was
tested earlier this week and that the test was successful. However, it
would take a daily close above resistance at 112.50 to convince us that
something more than just an 'oversold bounce' was taking place.
With the Commercials no longer buying aggressively in response to price
weakness there is a greater probability of a large decline.
Chart Source: http://www.sharelynx.com/
The Stock Market
Current Market Situation
Below are charts of the Utility Index and the S&P600 Small Cap Index.
The Utility Index traded below its 200-day moving average on Wednesday
for the first time since April-2003, but recovered to end the session
right at this moving average. We think this index is in the process of
forming a major top, but additional weakness will be needed to confirm
this view. As things currently stand, the price action would be
consistent with either a major top formation OR a correction within an
on-going bull market.
The S&P600 Index -- one of the leading indices over the past few
years -- came close to breaking below the bottom of its short-term
channel yesterday. However, it had rebounded enough by the end of the
day to remain within this channel and avoid sending a bearish signal.
We expect that a
substantial decline will occur over the next 6 months, but even if we
are right it's quite possible that some indices will first move to new
multi-year highs.
Gold and
the Dollar
Gold, Gold Stocks and Silver - Overview
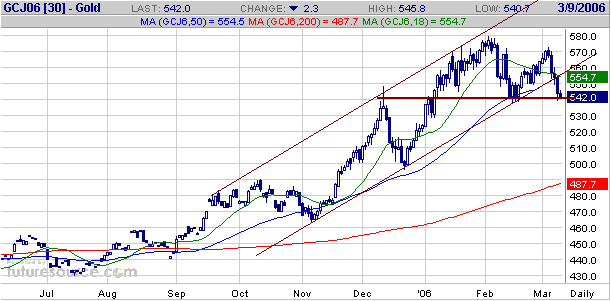
In the 20th February Weekly Market Update, with spot gold trading at
$552, we upgraded our short-term view on gold from "neutral" to
"bullish" and have been prepared to give the short-term bullish case
the benefit of the doubt as long as the price remained within the
upward-sloping channel drawn on the following chart. However,
yesterday's decline resulted in a decisive break below the channel
bottom. We have therefore gone back to a short-term "neutral" view on
gold.
In early February, with spot gold at $567 and the XAU at 148, we turned
intermediate-term bearish on both gold and the gold sector of the stock
market. Our views were that a) intermediate-term peaks were either
already in place or would be put in place within the ensuing two
months, and b) gold and the major gold stocks would be trading at
significantly lower levels within the ensuing 3-6 months. As a result
of this week's action it is now almost certain that an
intermediate-term peak was put in place in the gold sector of the stock
market at the end of January and very likely that an intermediate-term
peak was put in place in the gold market at the beginning of February.
However, in terms of price the intermediate-term correction in the XAU
is probably already 75% complete and the intermediate-term correction
in gold bullion is probably already 50% complete. We are therefore
upgrading our intermediate-term views on gold and gold stocks from
"bearish" to "neutral".
Ideally, the XAU and the HUI will work their way down to around 115 and
260, respectively, over the coming 4 weeks and gold bullion will drop
to the low-$500 area. We say "ideally" because such a decline would set
up a good opportunity for investors to accumulate exploration-stage
gold stocks and/or gold bullion.
Unlike gold, silver hasn't yet broken its short-term upward trend. If
gold breaks below support at $540 then it's a good bet that silver will
be pushed low enough to confirm an end to the short-term upward trend,
but we don't think silver will be vulnerable to the sort of spectacular
decline it experienced during the second quarter of 2004 unless it
first spikes well above last week's high.
Gold Stocks
The
odds are in favour of the HUI trading below yesterday's low within the
coming few weeks, but the sort of collapse that occurred in 2004 is
unlikely to occur this year.
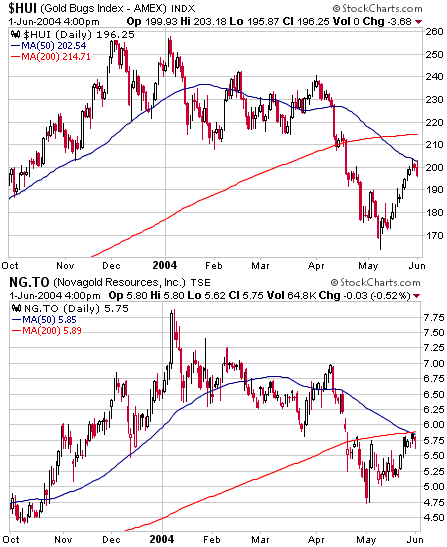
Below is a chart comparison of the HUI and the stock price of NovaGold
Resources (TSX and AMEX: NG) -- in our opinion the world's premier
exploration-stage gold mining company because it has the best
combination of projects and management -- covering the period from the
beginning of October-2003 through to the end of May-2004. Notice that:
1. NG and the HUI peaked together in early December of 2003 and then experienced 2-week pullbacks
2. The HUI then rebounded to a marginally lower peak at the beginning
of January-2004 while NG moved well above its December peak.
3. On the day that the HUI was making its secondary (lower) high in early January the NG stock price gained about 10%.
4. The HUI then dropped to a lower low (below its December pullback
low) by early February while NG dropped to a higher low. A 2-month
rebound/consolidation then got underway.
5. The HUI and NG then declined to well below their respective 200-day moving averages.
Now let's take a look
at what has happened to the HUI and NG in the recent past. With
reference to the below chart comparison, notice that:
1. NG and the HUI peaked together in early February of 2006 and then experienced 2-week pullbacks
2. The HUI then rebounded to a lower peak at the beginning of March-2006 while NG moved well above its February peak.
3. On the day that the HUI was making its secondary (lower) high in early March the NG stock price gained about 10%.
4. The HUI has since dropped to a lower low (below its February
pullback low) while NG has remained comfortably above its February low.
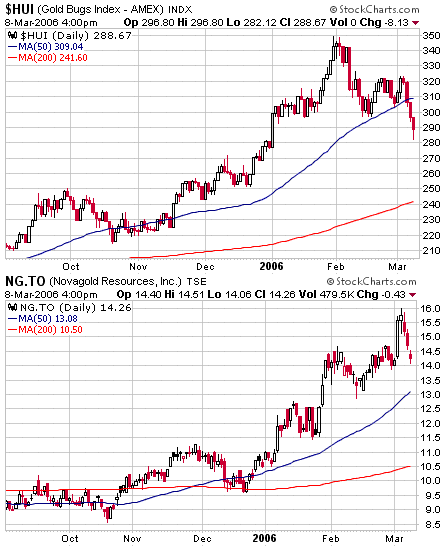
If the similarities
between the 2003-2004 topping action and the current situation persist
then the HUI will make a short-term bottom about 3 weeks from now.
There will then be a modest 2-month rebound followed by a collapse.
The odds are in favour of the HUI trading below yesterday's low within
the coming few weeks, but the sort of collapse that occurred in 2004 is
unlikely to occur this year. The rally that ended in December of 2003
for the major gold stocks and in the first quarter of 2004 for the
exploration-stage gold stocks was the LAST intermediate-term advance
within a 3-year bull market, whereas the rally that began in May of
2005 will, in our opinion, prove to be the FIRST intermediate-term
advance within a new multi-year bull market. We are therefore expecting
a normal intermediate-term correction -- as opposed to a cyclical bear
market -- to play-out at this time.
The biggest risk for the gold sector over the next few months is a large downturn in the broad stock market.
Currency Market Update
In the latest Weekly Update we wrote:
"The Dollar Index closed
below its 50-day moving average at the end of last week, a sign that a
drop back to test the January low is going to occur over the next few
weeks. However, the discrepancy between the performance of the US bond
market and the performance of the US$ during the final two days of last
week makes us suspect that either the weakness in the bond market or
the weakness in the US$ was a 'head fake' (there had been a strong
inverse correlation between bonds and the dollar prior to last
Thursday).
If bonds reverse higher
this week then the Dollar Index is probably on its way to support at 88
and has an outside chance of moving all the way back to the more
important support that exists at around 86, but if bonds keep moving
lower then there's a good chance that the US$ will reverse upward."
Bonds continued to move lower and the US$ reversed higher during the
first half of this week, meaning that last week's breakdown in the
Dollar Index was probably a 'head fake'. The drop in the US$ that
occurred late last week was a reaction to the ECB's decision to boost
the official euro interest rate by 0.25%, but we suspect that a
concerted effort by the ECB to tighten its monetary policy would
represent more of a threat to the upward trend in commodity prices than
to the upward trend in the US$. This is because the dollar's interest
rate advantage is not going to disappear in the near future.
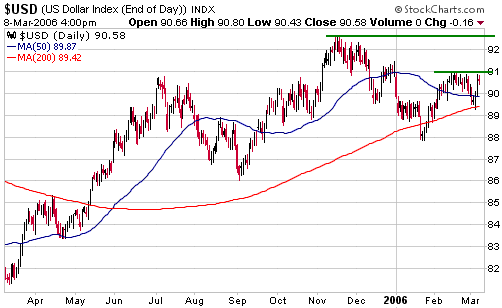
The following chart shows that the Dollar Index has important
resistance at 91 and at 92.5. A weekly close above 91 would be a
definitive bullish signal.
The following chart
shows that Canadian Dollar futures have just broken below the bottom of
a "rising wedge" pattern. However, we'll need to see a close below 0.85
before we will be confident that an intermediate-term correction is
underway.
The C$ has had one of the highest inflation rates of the major
currencies over the past two years, making it vulnerable to a sharp
decline. Up until now the demand for the C$ has been given enough of a
boost by the bull markets in energy-related commodities and metals to
more than offset the effects of increasing currency supply, but once it
becomes clear that large corrections are underway in the oil and
industrial-metal markets we think the C$ will become a relatively weak
currency.
Update
on Stock Selections
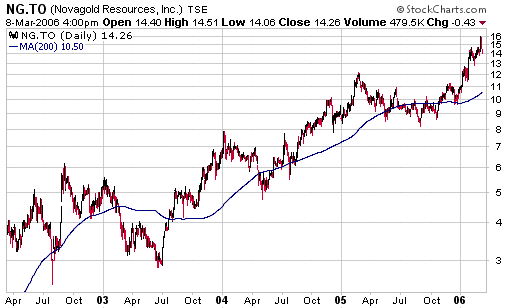
 Below is a chart of NovaGold Resources (TSX and AMEX: NG) covering the past 4 years. Below is a chart of NovaGold Resources (TSX and AMEX: NG) covering the past 4 years.
NG is our favourite long-term investment in the gold sector, but with
the stock price currently a great distance above its 200-day moving
average we don't think it makes sense to be doing any new buying at
this time. During each of the past 4 years there has come a time when
NG traded at least 10% BELOW its 200-day moving average (the blue line
on the following chart) and we have no reason to think that this year
will be different.
So why not make a complete exit from the stock now with the aim of buying back at a much lower level later this year?
Because the future is not certain. It is almost a certainty that NG
will drop back to its 200-day MA at some point over the next 12 months,
but we have no way of knowing where this moving average will be when
the stock price reaches it. For example, if NG were to do a deal in the
near future that involved a major mining company agreeing to fully fund
the development of the Galore Creek project in exchange for 50% equity
in the project then the NG stock price might quickly surge to $25
before a large correction got underway. In this case, by the time the
stock price corrected back to 10% below the 200-day MA the moving
average might be at C$18 or higher.
In general, if you
have good reason to believe that a stock's long-term upside potential
is much greater than its short-term downside risk then it will make
sense to retain a core position in the stock. An exception to this
general rule would occur if a stock with good long-term upside
potential became very over-valued relative to other stocks, in which
case it might make sense to switch out of the over-valued stock.
 When the gold sector was rocketing higher we mentioned above-the-market
price levels for individual stocks at which some profit-taking might be
appropriate, but now that a correction is well underway it's reasonable
to note price levels for individual stocks at which some new buying
might be appropriate. Here are a few ideas (sorted alphabetically):
- Canarc Resource (TSX: CCM) -- buy in the low-C0.70s (current price: C$0.75)
- DRDGold (NASDAQ: DROOY) -- buy in the US$1.20s (current price: US$1.40)
- Golden Queen Mining (TSX: GQM) -- buy below C$0.60 (current price: C$0.58)
- Kinross Gold (NYSE: KGC) -- buy in the US$8.70s (current price: US$9.24)
- Lion Selection Group (ASX: LSG) -- buy in the A$1.80s (current price: A$1.92)
- Metallica Resources (AMEX: MRB) -- buy at US$2.30-$2.50 (current price: US$2.97)
- Metallic Ventures (TSX: MVG) -- buy below C$2.45 (current price: C$2.40)
- New Gold (AMEX: NGD) -- buy in the US$6.70s (current price: US$7.73)
- Nevsun Resources (AMEX: NSU) -- buy below US$2.20 (current price: US$2.17)
With the exception of Kinross Gold, Lion Selection Group and New Gold,
the above stocks are current members of the TSI Stocks List.
Note that how much you buy and at what price you attempt to buy will be
partly determined by your current exposure to the gold sector. For
example, if you already have a sizeable core position in gold stocks
then you can afford to be more stingy than someone who is just starting
to build a portfolio.
Chart Sources
Charts appearing in today's commentary
are courtesy of:
http://stockcharts.com/index.html
http://www.futuresource.com/

|

