![]()
![]()
![]()
![]()
- Interim Update 8th March 2017
Copyright
Reminder
The commentaries that appear at TSI
may not be distributed, in full or in part, without our written permission.
In particular, please note that the posting of extracts from TSI commentaries
at other web sites or providing links to TSI commentaries at other web
sites (for example, at discussion boards) without our written permission
is prohibited.
We reserve the right to immediately
terminate the subscription of any TSI subscriber who distributes the TSI
commentaries without our written permission.
Revisiting the
limitations of sentiment
It was only three months ago*
that we last discussed the limitations of sentiment as a market timing
indicator, but we are revisiting the topic today to mention an additional
pitfall and a more topical example.
It's important to state up
front that despite the associated pitfalls, it can definitely be helpful
to track the public's sentiment and use it as a contrary indicator. This
is because most participants in the financial markets get swept up by the
general mood. They end up buying into the idea that prices are bound to go
much higher despite valuations having already become unusually high or the
idea that prices will continue to slide despite current valuations being
unusually low. This causes them to be very optimistic near important price
tops and either very pessimistic or totally disinterested near important
price bottoms.
It will always be this way because 1) a major
price/valuation trend can't end until the fundamental story behind the
trend has been fully embraced by 'the public', and 2) the public's own
buying/selling shifts the probability of success. For example, when the
public gets enthusiastic about an investment its own buying pushes up the
price of the investment to the point where future performance is
guaranteed to be poor. Consequently, there is no chance that the investing
public can ever collectively enter or exit any market at an opportune
time.
There are, however, three potential pitfalls associated with
using sentiment to guide buying/selling decisions.
The first is
linked to the reality that sentiment generally follows price, which makes
it a near certainty that the overall mood will be at an optimistic extreme
when the price is near an important top and a pessimistic extreme when the
price is near an important bottom. The problem is that while an important
price extreme will always be associated with a sentiment extreme (extreme
optimism at a price high and extreme pessimism at a price low), a
sentiment extreme doesn't necessarily imply an important price extreme.
For example, if the price of an investment has been trending strongly
upward for many months and is at an all-time high then sentiment
indicators will almost certainly reveal great optimism even if the upward
trend still has a long way to go. It is therefore dangerous to take large
positions based solely on sentiment.
The second potential pitfall
associated with using sentiment to guide buying/selling decisions is that
what constitutes a sentiment extreme will vary over time, meaning that
there are no absolute benchmarks. Of particular relevance, what
constitutes dangerous optimism in a bear market will often not be a
problem in a bull market and what constitutes extreme fear/pessimism in a
bull market will often not signal a good buying opportunity in a bear
market. In other words, context is critical when assessing sentiment.
Unfortunately, the context is always a matter of opinion.
We have
mentioned the above sentiment issues many times over the years, but
there's a third potential pitfall that we don't recall mentioning in the
past. It mainly relates to the sentiment indicators that are based on
surveys.
Regardless of what the surveys say, there will always be a
lot of bears and a lot of bulls in any financial market. It must be this
way otherwise there would be no trading and the market would cease to
function. As a consequence, if a survey shows that almost all traders are
bullish or that almost all traders are bearish it means that the survey
has a very narrow focus. In other words, the survey must be focused on a
small fragment of the overall market.
There is no better example
of sentiment's limitations as a market timing indicator than the US stock
market's performance over the past few years. To show what we mean we'll
use the results of the sentiment survey conducted by Investors
Intelligence (II), which has the longest track record** and is probably
the most accurate of the stock market sentiment surveys.
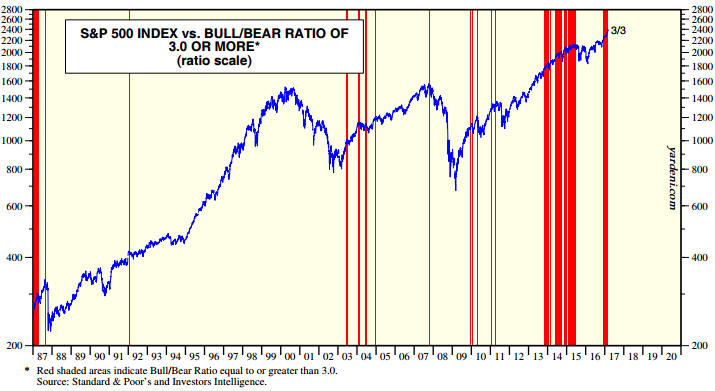
The
following chart from Yardeni.com
shows the performance of the S&P500 Index (SPX) over the past 30 years
with vertical red lines to indicate the weeks when the II Bull/Bear ratio
was at least 3.0 (a bull/bear ratio of 3 or more suggests extreme optimism
within the surveyed group).
Notice that vertical red lines
coincided with most of the important price tops (the 2000 top was the big
exception), but that there were plenty of times when a vertical red line
(extreme optimism) did not coincide with an important price top. Notice,
as well, that optimism was extreme almost continuously from Q4-2013 to
mid-2015 and that following a correction the optimistic extreme had
returned by late-2016.
In effect, sentiment has been consistent
with a bull market top for the past 3.5 years, but there is not yet any
evidence in the price action that the bull market has ended.
The bottom line is that sentiment can be a useful indicator, but it
does have serious limitations. It is just one medium-sized piece of a
large puzzle.
*In the 5th December 2016
Weekly Update
**The II sentiment data goes back to
1963
Commodity and T-Bond
prices are breaking out to the downside
Commodities
The gold price has broken below support at $1220, but gold is
fundamentally different from every other commodity and is always
considered separately in these pages. When we use the word "commodity" we
are referring to things that are consumed, such as oil or copper or
soybeans or cocoa or cotton. Our main concern is usually with what we
refer to as the industrial commodities, a category that includes the
energies (oil, natural gas, coal, etc.) and the industrial metals (copper,
zinc, etc.). Oil and copper, two of the most important industrial
commodities, have just broken out to the downside on their respective
price charts.
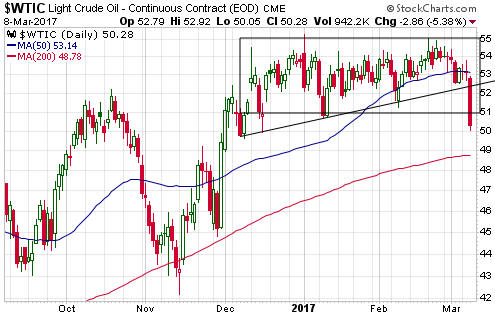
With regard to the oil market, this is how we
concluded a brief discussion in the latest Weekly Update:
"We
see the potential for oil to quickly move up to $58-$62 before making a
multi-month top, but we expect it to be trading substantially lower in
three months' time.
Note that a daily close above $55 would be an
upside breakout and a daily close below $51 would be a downside breakout.
A downside breakout would suggest that a multi-month top was already in
place."
A downside breakout (a daily close below $51) happened
on Wednesday 8th March. It therefore looks like oil's rally from its
November low ended last month and that an intermediate-term decline has
begun. We doubt that this decline will result in the January-2016 low
being tested, but we expect to see oil trading below $40 within the next
three months.
As an aside, oil's rally from its early-November low
was linked to the stock market's rally, so the evidence that oil's rally
is over adds to the reasons to be concerned about short- and
intermediate-term downside risk in the stock market.
With regard to the copper market, a definitive breakdown would require
a daily close below lateral support at $2.60, which hasn't yet happened.
However, the daily close below the 50-day MA on Tuesday 7th March is a
warning that a breakdown is coming.
Below $2.60 there is strong
support at $2.45 and in the low-$2.30s. We won't be surprised if the price
rebounds from $2.60 to as high as $2.70, but we suspect that an
intermediate-term decline is underway and that the price will fall at
least far enough within the coming three months to test the lower of the
aforementioned support levels.
Note that this bearish
short-to-intermediate-term outlook for copper applies to industrial metals
in general, as they are mostly in sync with each other (as is often the
case).
Treasury Bonds
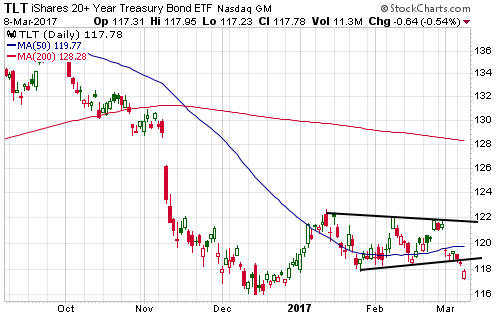
In the latest Weekly Update, we
wrote:
"...the recent price action in all markets, not just the
bond market, opens up an alternative possibility. The alternative is that
there will be a plunge in TLT [the iShares 20+ Year Treasury ETF] to well
below its December low before a substantial counter-trend rally gets
underway.
With reference to the following chart, important support
lies at 118 and important resistance lies at 122. A daily close above 122
would point to a rally extension to as high as 128-130, while a daily
close below 118 would suggest that the alternative scenario mentioned
above was in play."
TLT closed slightly below 118 on Wednesday
8th March, so the alternative scenario appears to be in play.
We expect that if TLT breaches its December-2016 bottom then bond
market weakness (rising interest rates) will become a big problem for the
stock market. In other words, we could soon have even more reason to be
concerned about downside risk in the stock market.
The Stock Market
The US
Did SNAP ring a bell?
The founders
of Snap Inc. (SNAP) rang the NYSE opening bell a week ago, but the above
question pertains to whether the listing of SNAP at a blatantly ridiculous
valuation and the rocketing of the share price to a premium of 50% to the
aforementioned ridiculous valuation during the first two days of trading
marked an important top.
The absurdity of the company's market
valuation is underlined by it supposedly being worth:
a) About
65-times annual sales revenue
b) About the same as eBay
c)
About 3-times as much as Twitter
This is despite the company being
spectacularly unprofitable. So unprofitable, in fact, that for every one
dollar of sales, it loses more than one dollar (its annual losses are
greater than its annual sales revenue). And yet, the IPO was apparently
about 10-times oversubscribed!
SNAP's IPO valuation and subsequent
trading performance are such obvious signs of excess that it may well
represent the proverbial bell that rings to announce a market top. It
probably didn't 'announce' a major top, but it could well have ushered in
a top that holds for at least a few months.
Current Market Situation
The SPX
has pulled back from its 1st March high of 2401, but it has been a very
minor correction to date. It could evolve into something far more
significant, but there could also be a surge to a new high within the
coming 1-2 weeks prior to the start of a far more significant correction.
Either of these possible outcomes would be consistent with our
expectations.
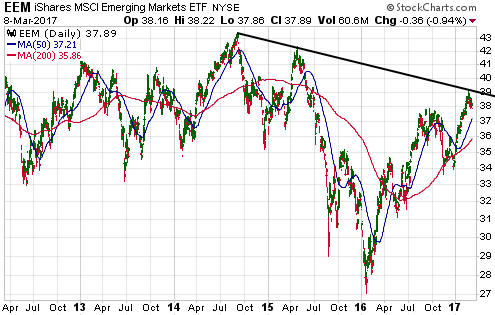
Emerging Market Equities
EEM (the iShares
Emerging Markets ETF) is a proxy for "emerging market" equities in US$
terms. It reached its peak for the year of US$39.15 on 23rd February.
Interestingly and as shown on the following daily chart, the February peak
coincided with a trend-line drawn through the 2014 and 2015 peaks.
The pullback from the February peak is minor to date but will start to
look significant if there's a daily close below $37.
Downward trends in EEM tend to be driven by at least one of the
following:
1) Strength in the US$
2) Weakness in commodity
prices
3) Weakness in the US stock market
Our favoured 1-3
month scenario encompasses all three of the above, so we perceive
substantial downside risk in EEM. That's why, as mentioned in the past few
Weekly Updates, we have purchased June EEM put options for our own
account.
Our purchase of EEM puts was made primarily for hedging
(that is, insurance) purposes, but a position in EEM puts could also be a
reasonable speculation for traders who are familiar with options.
We have added an EEM June-2017 $35 put-option position to the TSI Stocks
List based on the expectation that EEM will drop to $34 or lower within
the coming three months. The closing price for this option on Wednesday
8th March was US$0.46 while the closing bid-offer spread was $0.50-$0.55.
For record purposes we'll take the middle of the bid-offer spread, that
is, $0.525, as our starting price.
It would be reasonable to set a
daily EEM close above $39.15 as an initial stop for this trade.
Gold and the Dollar
Gold
In
the latest Weekly Update, we wrote:
"...we now have a
preliminary signal that a short-term top is in place [for the US$ gold
price]. Furthermore, given the bearish divergence in the HUI/gold ratio in
the weeks leading up to last week's reversal in the gold price it's likely
that the preliminary signal of a top will be followed by a more conclusive
signal.
A more conclusive signal would be a daily close below
lateral support at $1220, which could happen as soon as this week but
might not happen until late-March or early-April."
The gold
price closed below $1220 on Tuesday and extended its decline on Wednesday,
so the more conclusive signal of a short-term top is now in place.
Both gold and silver reached their 50-day MAs on Wednesday 8th March
and the gold-mining stocks have begun to show some resilience, which
suggests the potential for a rebound over the next few days. However, this
is not something to bet on, because despite the recent sell-off the
short-term risk/reward is far from bullish. Furthermore, after shifting
far enough in a bullish direction to turn neutral a few weeks ago, the
fundamental backdrop is back to being gold-bearish thanks to the recent
rise in real US interest rates (as indicated by TIPS yields).
We
think that a better buying opportunity is coming and would view
significant near-term price strength as an opportunity to do some
additional hedging.
Gold Stocks
The HUI
extended its decline over the first three days of this week, although it
held up fairly well considering the weakness in metal prices. It has now
fallen far enough that its 50-day MA should act as a ceiling during the
next significant rebound.
A test of the December-2016 low (160) looks inevitable, but there are
many paths that could be taken to get there. For one example, with the
market now 'oversold' there could be a rebound to as high as 200 before
the downward trend resumes. In this case, the December-2016 low wouldn't
be tested until April or May. For another example, there's a risk that
panic will soon set in, leading to the December-2016 low being tested
within the coming fortnight.
Of the two possible paths mentioned
above, the latter would be the easier to trade. This is because the
intense emotions associated with a panic sell-off create buying
opportunities that are both terrific and obvious for anyone with plenty of
cash who 'keeps their head'.
The Currency Market
The Dollar Index is again challenging resistance at 102. This is the
resistance that must be decisively breached to remove the remaining doubt
that a correction low was put in place in early-February.
The stage is set for the market reaction to the monthly US Employment
Report on Friday 10th March to clearly signal whether or not the US$
correction that began in December is over. It is probably over, but a
failure to end this week above 102 would leave open the possibility of a
decline to as low as the 200-day MA (currently at 98.1) prior to a
correction low.
Note that the coming Employment Report will have to
be extremely weak or extremely strong to have any effect on market
expectations regarding the Fed's likely actions.
Updates on Stock Selections
Notes: 1) To review the complete list of current TSI stock selections, logon at
http://www.speculative-investor.com/new/market_logon.asp
and then click on "Stock Selections" in the menu. When at the Stock
Selections page, click on a stock's symbol to bring-up an archive of
our comments on the stock in question. 2) The Small Stock Watch List is
located at http://www.speculative-investor.com/new/smallstockwatch.html
Chart Sources
Charts appearing in today's commentary
are courtesy of:
http://stockcharts.com/index.html
![]()