|
- Interim Update 8th April 2009
Copyright
Reminder
The commentaries that appear at TSI
may not be distributed, in full or in part, without our written permission.
In particular, please note that the posting of extracts from TSI commentaries
at other web sites or providing links to TSI commentaries at other web
sites (for example, at discussion boards) without our written permission
is prohibited.
We reserve the right to immediately
terminate the subscription of any TSI subscriber who distributes the TSI
commentaries without our written permission.
No Weekly Update this coming Sunday
We will be traveling over the Easter weekend and the following week. As
a result we won't be publishing our usual report on Sunday 12th April.
If things go according to plan we will, however, be able to publish the
Interim Update at around the normal time on Thursday 16th April.
Replacing private debt with public debt
Total private debt in the US is around $50T (50 trillion dollars). To
date, in its attempts to 'fight' the emerging economic depression, the
US government and the Federal Reserve have spent, lent or committed
$US12.8T (as reported by Bloomberg). Almost all of the new spending and
lending has occurred or been committed over the past seven months,
which means that the government-Fed tag team has been increasing its
monetary obligations at the annualised rate of around $20T. If this
rate continues then by the end of 2010 the government's
'depression-fighting' monetary commitment will amount to almost 100% of
the current total private-sector debt burden. And yet, some people
continue to claim that the government's attempts to inflate will be
overwhelmed by the contraction in private sector debt. To these people
we respectfully say: wake up!
Analysing Inflation/Deflation
Economics is all about
human action and must therefore be treated as a logical science, not an
empirical one. To put it another way, in the realm of economics you
generally can't, or at least you shouldn't, use data to develop a
theory. Instead, to have a good chance of understanding real-world
economic outcomes you must BEGIN with a sound theory. Otherwise you
will likely confuse cause and effect, perceive cause-effect
relationships that don't exist, or wrongly interpret the data in some
other way.
The above is as true with regard to inflation/deflation as it is with
any other macro-economic issue. In particular, because inflation
(money-supply growth) affects the prices of different things in
different ways at different times, and because the effects of inflation
go well beyond price increases, you can't possibly understand
inflationary effects by simply monitoring the price performance of any
one thing or any group of things.
Here's an example of what we mean: It is widely believed that a rising
T-Bond price (a falling T-Bond yield) signals a falling inflation
threat. But what if the Fed decided to buy T-Bonds with newly-created
money in a deliberate attempt to reduce the T-Bond yield? In this case
the bond market would be the main initial beneficiary of the monetary
inflation and a rising T-Bond price (a falling T-Bond yield) would be a
symptom of a RISING inflation threat.
The above example is obviously not hypothetical given that the Fed has
promised to create new money to buy T-Bonds and the initial market
reaction to this heightened inflation threat encompassed LOWER bond
yields.
By logical deduction we know that there are conditions under which the
relationship between bond yields and inflation will be the opposite of
what is commonly believed. We also know that a central bank policy that
involves creating new money to suppress interest rates will eventually
become counter-productive because the new money that initially BOOSTS
the demand for bonds will eventually work its way through the economy
and create effects that REDUCE the demand for bonds.
Greenspan's Mistake
Former Fed Chief Alan
Greenspan has stridently argued that his decision to lower the Fed
Funds Rate (FFR) from 6.5% to 1.0% during 2001-2003 was NOT the cause
of the housing bubble.
In our opinion it is overly simplistic to argue that the Fed's interest
rate manipulations during the early years of this decade caused the
housing bubble, meaning that Greenspan is at least partly right to
argue that there were other powerful forces at work. Rather than
pointing the finger of blame at any single Fed action, we think it is
more appropriate to view the Fed as the 'great enabler' of the range of
monetary excesses that led to the bubble and the subsequent bust.
Having said that, we strongly believe that the Fed erred badly when
setting its interest rate target during the first half of this decade.
Specifically, it is clear to us that the Fed held its official target
rate too low for too long during much of 2001-2005. To support our
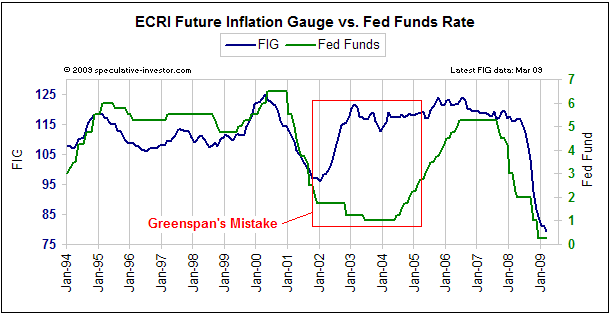
claim we present, below, a chart comparing the FFR target with
something called the Future Inflation Gauge (FIG). The Future Inflation
Gauge is calculated by the Economic Cycle Research Institute (ECRI) and
is an attempt to quantify that future EFFECTS of inflation.
Our chart begins in 1994, but note that the FFR had been trending up
and down with the FIG from the time Greenspan took the helm of the Fed
in 1987. Towards the end of 2001, however, the two began to head in
opposite directions. The chart's message is that the Fed continued to
lower the FFR during 2002-2003 even though the inflation threat was
growing, and then held the FFR at an unreasonably low level throughout
2004 and the first half of 2005.
Alan Greenspan has a unique opportunity right now, which,
unfortunately, he will almost certainly let pass. Regardless of how
aggressively he argues to the contrary, he will go down in history as
the Fed chairman who blundered so badly that he set the scene for the
second Great Depression. There is nothing he can do about that now.
What he can do is to not only admit the mistakes that were made under
his stewardship, but to explain that, regardless of how many resources
are brought to bear and the intelligence of the people involved, such
mistakes will inevitably occur when you give a person or a group of
people the power to override the market. If he did that he would make
up for decades of wrongheadedness.
The Stock Market
Current Market Situation
The following daily chart makes the point that the S&P500 Index
(SPX) has important resistance at 850. It is now consolidating after
testing this resistance late last week.
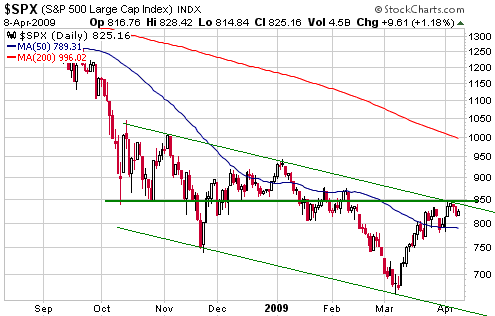
Our view is that the
stock market is immersed in a counter-trend rally that will, at a
minimum, take the SPX up to the vicinity of its 200-day moving average.
Japan
Here's an interesting quote from an interview with money manager Jean-Marie Eveillard:
"Japan is on the opposite
side of the world, both literally and figuratively. It is an
island in more ways than one. From a top-down perspective, Japan
is in much better shape than the US and Germany. Its companies
have massively over-capitalized balance sheets. The value of the
Nikkei index is at the same level as it was in 1984. Japan has
experienced 20 years of a bear market and 25 years of no returns.
Approximately 22% of
Japanese companies trade for less than net-net working capital
(NNWC). [Ed. Note: NNWC is current assets - current liabilities -
long-term debt] Between 10% and 15% of companies trade for
less than net cash value, and between 75% and 80% of non-financial
companies trade for less than their book value. These companies
have high quality assets -- cash, receivables, and depreciated fixed
assets.
The Japanese market is priced at Great Depression levels, but there are many high quality companies."
We turned long-term bullish on the Japanese stock market during the
second quarter of 2003, which looked like a smart decision for a while
but doesn't look so smart now. Our reasoning was that equity valuations
were low in Japan and that 13 years was a normal duration for a secular
bear market (the Nikkei's secular bear market began at the end of
1989).
Japanese equity valuations are now even lower (at "Great Depression
levels", according to Mr. Eveillard), so even though the
intermediate-term outlook for Japan's economy is dismal this appears to
be a good time for investors to build up some exposure to the Japanese
stock market.
The biggest risk in Japan is the government. Japan's economy would have
moved onto a sustainable growth path long ago if not for the many
attempts to stimulate it via increased government spending.
Unfortunately, in Japan and throughout much of the world bad economic
theory ("Keynesianism") continues to prompt bad economic policy, which,
in turn, undermines the economy's attempts to heal itself.
Gold and
the Dollar
Gold
April gold futures broke below support at $890 on Monday. This
breakdown creates a measured objective of around $800, but another
possibility is that the gold price is consolidating within a channel
(as indicated on the following daily chart) and will bottom-out in the
mid-$800s.
At the moment, movements in the US dollar's foreign exchange value seem
to be almost irrelevant to the gold market. A lot of gold buying was
prompted over the past few months by fears about what was happening to
the financial system and what governments/central-banks were doing to
their currencies and economies. The result was a sharp rise in the gold
price from $700 to $1000 at the same time as the price of just about
every other asset was falling. These fears were rational and will
almost certainly re-emerge later this year, but they are temporarily
abating in response to the global stock market rebound.
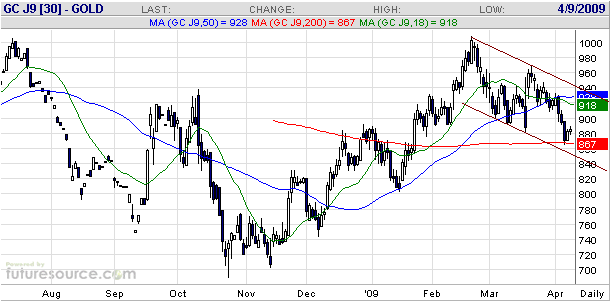
Gold's decline from
its February peak is good news for anyone who doesn't have a full
position. For those wanting to increase their bullion exposure our
suggestion is to begin buying in the $850s.
Regardless of what vehicle you choose to obtain your gold (or silver)
bullion exposure, make sure that the price you pay is close to (within
a few percent of) the spot price. In other words, never pay large
premiums to the spot price. For example, do not consider buying the
Central Fund of Canada (CEF) or Central Gold Trust (GTU) unless their
premiums to net asset value are 5% or less. At the close of trading on
Wednesday these two funds were trading at premiums of 11.8% and 28.5%,
respectively.
Gold Stocks
The AMEX Gold BUGS Index (HUI) moved sharply higher between late
October and mid December of last year, but has since been drifting back
and forth within a slightly upward-tilted channel. This is a rarely
seen chart pattern. Usually, a consolidation within an upward trend
will be either downward sloping or flat.
The HUI's chart pattern could be interpreted in a bullish way in that
the sequence of rising lows and rising highs suggests that new buying
is coming in at progressively higher levels, as is profit taking. This
is our interpretation.
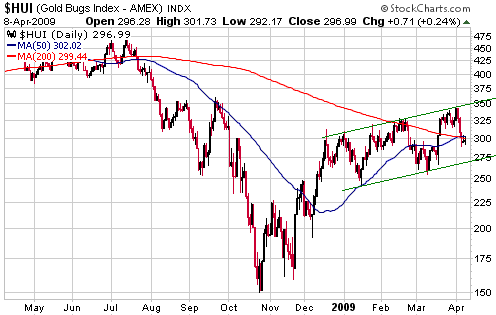
If the pattern of the
past four months continues then the HUI will drop to the low-270s
within the coming two weeks and then commence its next multi-week
advance. Of course, the pattern will not continue indefinitely -- the
HUI will eventually break out of its multi-month channel in one
direction or the other. Our expectation is that the eventual breakout
will be to the upside.
A daily close above 305 within the next few days would be a sign that
something more bullish than a near-term drop to the channel bottom is
on the cards, whereas a daily close below 260 at any time would
indicate that a multi-month high was put in place at the beginning of
April.
Currency Market Update
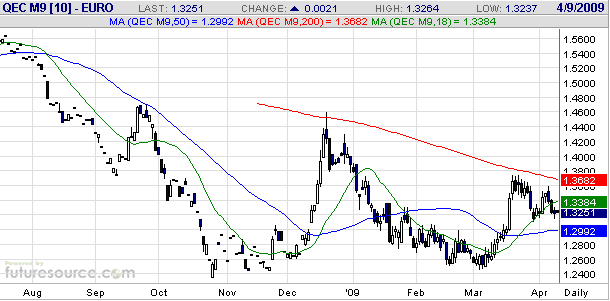
A daily chart of June euro futures is displayed below.
The euro dropped below its 18-day moving average (the green line on the
following chart) earlier this week, which is a short-term negative for
this currency. However, the short-term outlook for both the euro and
the Dollar Index can best be described as muddy. As far as the next few
weeks are concerned, the one thing that makes us favour a modest amount
of strength in the euro (and a modest amount of weakness in the US$) is
the fact that since July of last year there has been an inverse
correlation between the stock market and the Dollar Index. We are
anticipating some additional strength in the stock market, so if the
currency-equity relationship of the past 9 months persists then this
should go with some weakness in the US$.
Update
on Stock Selections
(Note: To review the complete list of current TSI stock selections, logon at http://www.speculative-investor.com/new/market_logon.asp
and then click on "Stock Selections" in the menu. When at the Stock
Selections page, click on a stock's symbol to bring-up an archive of our comments on the stock in question)
 Continental Airlines (NYSE: CAL). Recent price: US$11.70 Continental Airlines (NYSE: CAL). Recent price: US$11.70
During the second week of March, with CAL trading near its recent low, we wrote: "...once
this stock bottoms the ensuing up-move tends to be explosive. In
addition to 2008, this was the case following intermediate-term bottoms
in 2002, 2003 and 2005. CAL is an interesting speculation at this time,
but only for those who can handle high volatility."
At this stage CAL is following a similar path to the previous 'V
bottoms' of the past 7 years. The current and the previous four 'V
bottoms' are identified on the chart displayed herewith.
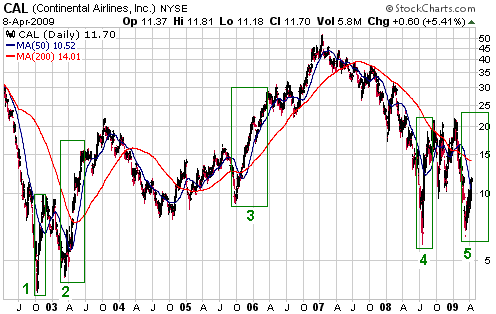
CAL tends to make
impressive V-bottoms because concerns periodically arise that the
company is headed for bankruptcy, prompting a vicious sell-off that
takes the stock's market capitalisation down to a small fraction of its
annual revenue. These fears then dissipate, prompting a powerful
rebound. In one way this makes CAL a terrific trading stock, but it
also makes risk management difficult and can result in small timing
errors being costly.
If CAL continues to follow a similar path to its previous four
V-bottoms then it will move back to $20-$25 within the next three
months. However, there is no guarantee that it will continue to follow
this path. Therefore, buyers of CAL near the recent low should, we
think, make at least a partial exit if the stock rises to $13-$14 over
the coming fortnight.
 Resolute Mining (ASX: RSG). Shares: 407M issued, 486M fully diluted. Recent price: A$0.71 Resolute Mining (ASX: RSG). Shares: 407M issued, 486M fully diluted. Recent price: A$0.71
In the 30th March Weekly Update we said that new buying of
Australia-based gold producer RSG would be appropriate following a
pullback to A$0.70-A$0.75. The stock has dropped into our 'buy zone'.
In fact, it traded as low as A$0.66 in Australian trading earlier
today.
RSG is suitable for new buying in the low-A$0.70s (or lower) and would be a partial sell at around A$1.00.
Chart Sources
Charts appearing in today's commentary
are courtesy of:
http://stockcharts.com/index.html
http://www.futuresource.com/

|

