![]()
![]()
![]()
![]()
- Interim Update 8th April 2020
Copyright
Reminder
The commentaries that appear at TSI
may not be distributed, in full or in part, without our written permission.
In particular, please note that the posting of extracts from TSI commentaries
at other web sites or providing links to TSI commentaries at other web
sites (for example, at discussion boards) without our written permission
is prohibited.
We reserve the right to immediately
terminate the subscription of any TSI subscriber who distributes the TSI
commentaries without our written permission.
The Stock Market
Valuation Update
How did the February-March crash in the US stock market affect
long-term valuation measures? Does the market now offer good value?
The answer to the first question is that the market's valuation at the
end of March was significantly more attractive than it was a month
earlier. However, the answer to the second question is that the market
remains a large distance above its long-term average value.
The
following monthly chart shows a few different measures of the SPX's
valuation relative to long-term averages. Of these measures, we prefer the
Cyclical P/E 10 (the red line). Of the valuation measures included on
the chart, this happens to be the one that is closest to its long-term
mean. Even so, it indicates that at the end of March the SPX was 48% above
its long-term average value, meaning that the SPX would have to fall by an
additional 30% or so to reach fair value.
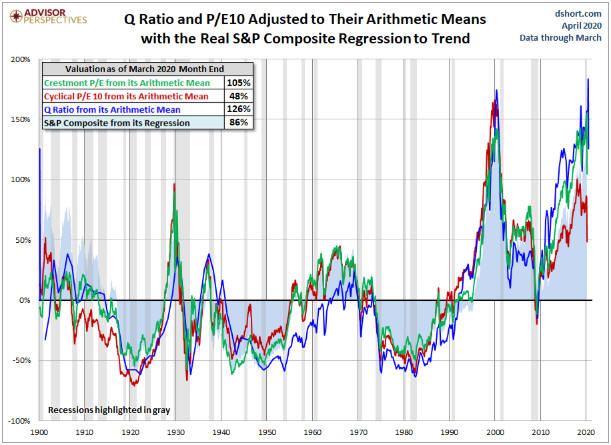
Source:
dshort
It has been argued that today's extremely low interest
rates justify a much higher than average stock market valuation. One
problem with this argument is that interest rates aren't going to stay
near current ultra-depressed levels for decades to come. Actually,
considering what governments and central banks are now doing in an effort
to counteract both the immediate problem of virus-related lockdowns and
the underlying problem of excessive indebtedness, it's likely that
interest rates will commence major upward trends this year.
Before
leaving the valuation issue, it's appropriate to point out the huge
valuation difference between the present time and 1918-1919. As is the
case today, economic activity during 1918-1919 was severely curtailed due
to a pandemic. Unlike today, however, in 1918-1919 private-sector debt
levels were low and the SPX's valuation was well below its long-term
average. An implication is that we shouldn't expect something akin to the
"Roaring 20s" over the coming decade, although it's possible that the
massive depreciation of money could enable the SPX to make a new all-time
high in nominal dollar terms within the next three years.
Current Market Situation
We expected a rebound from the
March crash low that retraced about half of the crash. For the SPX, this
meant that we expected a rebound to around 2800. Wednesday's high was
2760. This could be almost as good as it gets for now, or there could be
an extension of the rebound over the coming week or so. There is no way of
knowing.
With the initial post-crash rebound having run (or almost run) its
course it is appropriate to consider what comes next. We have made it
clear that we expect a test of the crash low, but there are always
multiple realistic possibilities. Even a test of the crash low encompasses
two very different scenarios, in that the test could be successful
(meaning: the market reverses upward from either slightly below or
slightly above the March low) or unsuccessful (meaning: the market breaks
through the March low and resumes the downward trend that began in
February).
We think that the myriad of short-to-intermediate-term
scenarios can be boiled down to three main ones. They are:
1) The
SPX's initial post-crash rebound ends soon and is followed by a decline to
the vicinity of the March low. The test of the low is successful and a
larger/longer rebound gets underway.
2) There is some corrective
activity over the weeks ahead, but the SPX remains well above its March
low. That is, there is no test of the low. After pulling back, the market
resumes the short-term upward trend that began on 24th March.
3)
The same as Scenario 1, except that the test of the March low is not
followed by a tradable rally. Instead, the SPX continues downward in fits
and starts, thus confirming that we are dealing with a major bear market.
Scenarios 1 and 2 probably require the general relaxation within the
next three months of the restrictions that have been imposed by
governments to limit the spread of the coronavirus, with a large
percentage of the population returning to work before the middle of the
year. These scenarios probably also require significant progress in the
identification of existing drugs that can be used to alleviate the
COVID-19 symptoms and greatly reduce the risk of death.
We think
that Scenario 1 is the most likely, because a) crash lows are usually
tested, b) we expect that common-sense will prevail with regard to getting
people back to work in the short-term, perhaps with the mandated use of
protective gear such as masks, and c) there is already evidence that some
existing drugs are effective in speeding the recovery from COVID-19. At
this stage, however, Scenario 3 cannot be ruled out.
It should be
pointed out that Scenario 1 does not imply the resumption of the long-term
bull market following a test of the March low. It implies nothing more
than a rally lasting at least a few months. It's possible that the
depreciation of money stemming from the inflationary programs introduced
by central banks and governments will enable the SPX to reach a new
all-time high as soon as 2022, but we wouldn't have to believe that a move
to all-time high territory was underway in order to profit from the rally
that would follow a successful test of the March low.
Arguing
against a test of the March low, that is, in favour of Scenario 2, is that
the vast majority of market participants and analysts appear to be
expecting a test. This widespread expectation could mean that even if
there is going to be a test of the low, before reversing downward the
market will move high enough to draw-in many of the sceptics.
We
continue to view 2800-2900 (for the SPX) as a realistic target range for
the initial post-crash rebound and we continue to think that the odds
favour a test of the March low (a decline to anywhere in the 2100-2300
range would qualify) after the initial rebound runs its course.
In
anticipation of the aforementioned test, the SPY June-2020 $230 put option
will be added to the TSI List if it trades at US$5.00 by the end of next
week. The option ended Wednesday's session at around $6.40 and we estimate
that for it to become available at our stipulated buy price the SPX will
have to rise to around 2850.
Gold and the Dollar
Gold
In
the latest Weekly Update, we wrote:
"The price action is
non-committal, but our guess is that gold will work its way towards a
May-June correction low, just like it did during the same period last
year. Due to the chaotic financial-market environment and the 1987
comparison, the correction could entail a quick spike to a new multi-year
high."
The following chart shows what we meant by our
reference to the 1987 comparison. Notice that in December-1987 the US$
gold price spiked to a new high for the year (with silver at a much lower
high) before embarking on a multi-month decline.
The spike to a new high for the year on Tuesday 7th April currently
looks similar to the December-1987 spike. The similarity with 1987-1988
will be underlined if at some point over the next few weeks the gold price
breaks below $1560 and eliminated if gold closes above the 7th April high
anytime soon.
The fundamental backdrop remains bullish for gold, but the large
speculator net-long position in gold futures and gold's extreme
expensiveness relative to other metals suggests that the bullish
fundamentals are fully discounted by the current price. Therefore, despite
the bullish fundamentals this is a time for gold investors to be cautious.
Silver
In our most recent two commentaries we
wrote that silver's initial post-crash rebound might have peaked a couple
of weeks ago near $15, but that it was still possible for an extension to
around $16. Recall that $15.50-$16.50 was the target range we originally
had in mind for the rebound that kicked off during the final week of
March.
The silver price almost made it to $16 during the first two
days of this week and then reversed downward. There's a good chance that
the post-crash rebound has ended and that a decline to test the crash low
has begun.
Gold Stocks
As is the case with the broad
stock market, there is more than one plausible short-term scenario for the
gold mining sector. In fact, the first two scenarios outlined above for
the SPX also apply to the HUI. The scenario involving a successful test of
the crash low is the more likely, because the historical record tells us
that crash lows are almost always tested, but there is a realistic chance
that the HUI's short-term upward trend will continue for a while with only
routine pullbacks along the way.
At the moment, from our
perspective the main difference between the broad stock market's
short-term risk/reward and the gold sector's short-term risk/reward is
that "Scenario 3" does not apply to the gold sector. That is, we don't
think there is a realistic chance of the gold mining indices and ETFs
making sustained breaks below their March-2020 lows over the months ahead.
This is because the sort of economic environment that would result in
confirmation of a major equity bear market would be bullish for gold and
the related mining stocks.
Moving on, the following excerpt from
last week's Interim Update remains relevant:
"...another test
of the 200-day MA could happen within the coming week or so, but unless
the HUI is able to achieve consecutive daily closes above its 200-day MA
the prudent assumption will be that the initial post-crash rebound is
complete and that a test of the crash low is coming. Therefore, near-term
strength should be viewed as a short-term selling/hedging opportunity.
There's a good chance that the crash low will be tested and a very
good chance that if it is tested the test will be successful (the March
low won't be breached). Therefore, if the HUI drops back to the 150s at
some point over the next two months you should just grit your teeth and
buy gold mining ETFs and/or stocks."
As illustrated below,
another test of the HUI's 200-day MA (the red line on the chart) happened
during the first half of this week.

Unless the HUI achieves consecutive daily closes above its 200-day MA,
the prudent assumption will be that the next significant move is to the
downside.
The Currency Market
The Dollar
Index (DX) is chopping around near the middle of its recent wide range.
Plausible fundamental arguments can be made for both a much stronger US$
and a much weaker US$ over the quarters ahead, but we suspect that the
downward pressure on the DX being exerted by the Fed eventually will trump
(no pun intended) all other considerations. Let's put it this way: If the
Fed's actions prove to be insufficient to create general weakness in the
US$, then the Fed will do more...and more...and more...until the US$
buckles. Unlike the ECB, the Fed will not face any short- or
intermediate-term political obstacles in its efforts to inflate.
Updates on Stock Selections
Notes: 1) To review the complete list of current TSI stock selections, logon at
http://www.speculative-investor.com/new/market_logon.asp
and then click on "Stock Selections" in the menu. When at the Stock
Selections page, click on a stock's symbol to bring-up an archive of
our comments on the stock in question. 2) The Small Stock Watch List is
located at http://www.speculative-investor.com/new/smallstockwatch.html
Chart Sources
Charts appearing in today's commentary
are courtesy of:
https://stockcharts.com/
![]()