|
- 08 May, 2002
The Role
of Luck
A person has a one-in-two chance of
correctly calling the outcome of a coin toss and approximately a one-in-one-million
chance of correctly calling 20 coin tosses in succession. However, if 10
million people are calling the coin tosses then after 20 tosses there will
probably be 10 people who called all 20 tosses correctly. Do these 10 people
have some special talent? Should we place them on pedestals and use words
such as 'brilliant' and 'gifted' to describe them? Should we bet all of
our savings on the ability of these 10 people to achieve a greater than
50% success rate in calling future coin tosses? No, not if we have even
a basic understanding of probability.
We shouldn't make the above-mentioned
bet because these 10 people do not have a better-than-average ability to
correctly call the toss of a coin. The 20 correct calls were the result
of luck and provide no indication of what we can expect in the future.
However, we often do bet heavily on these people.
Joe Battipaglia is a good example of
someone who achieved a great deal of respect through correctly calling
20 coin tosses. Back in the good old days before we quit watching CNBC
we would often listen to JB's explanations as to why the bull market would
continue for many more years. JB's reasoning was completely bogus - not
once did he acknowledge that a massive expansion of credit was primarily
responsible for fueling the gains in asset prices - but because the market
kept going up he looked smart (at least he did to anyone who judges smartness
purely by results). Abby Joseph Cohen is another example. She correctly
called 20 coin tosses in a row and was almost deified by both the general
public and the professional investment community. Unfortunately or fortunately
depending on your perspective, the dominant role that luck played in her
ability to make so many correct calls during the bull market (as was the
case with JB, AJC's logic was faulty) has become clear over the past 2
years.
We can never know whether someone's
trading/investing success is primarily the result of skill or luck unless
we fully understand their methodology. However, it is often not possible
to determine the process that someone went through before making a decision
that turned out to be profitable. In other words, it is often not possible
for us to determine whether someone's good track record is mainly the result
of good luck or good judgement.
How about our own trading/investment
successes? Were they the result of good luck or good judgement? Although
most people are quick to blame losses on bad luck we've found that it is
rare for someone to attribute their successes to good luck. If we buy a
stock based on a careful analysis of the available evidence and the price
of the stock subsequently rockets higher, then we will surely congratulate
ourselves on our investment acumen. The fact that the stock might have
gone up for some reason that is unknown to us, meaning that our profits
are totally the result of luck, will never occur to us.
We usually won't be able to determine
if luck played a significant role in any of our successful investment/trading
decisions since we will never know all the variables that could have affected
the outcome. However, it is always prudent to acknowledge that luck could
have been a factor. This is another way of saying that it is better to
err on the side of caution. If we acknowledge that past successes might
have at least partly been the result of good luck then we will be less
likely to make a costly mistake in the future. A lot of lucky traders made
fortunes during the stock market mania of 1998-2000 and then gave all the
money back during the NASDAQ bust because they didn't know they were lucky.
They thought they were very smart.
The US
Stock Market
Current Market Situation
From the latest Weekly Update: "Some
additional weakness will probably occur in the short-term - either in the
form of a washout during this week or a bounce followed by a drop to re-test
last week's lows - but we think a medium-term bottom is close at hand."
One of the difficulties we have in
assessing the current market is that while some sentiment indicators reveal
the depths of despair that would normally lead to a multi-week or perhaps
even a multi-month rally (on the basis that everyone who was going to sell
has already sold), other sentiment indicators still reveal complacency.
For example, while the action on Monday and Tuesday should have
created panic since major support levels had either been taken out or were
being tested, it did not. As such, although the market has now turned higher
in-line with our forecast we are skeptical that this advance has 'legs'.
The sentiment picture might be confused,
but the technical picture is showing some definite signs that a medium-term
bottom was reached earlier this week. For example:
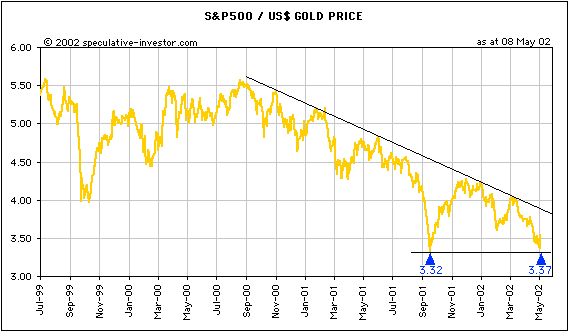
1. The S&P500/gold ratio (the number
of ounces of gold it takes to buy the S&P500 - what we call the "real
S&P500") reversed higher from within spitting distance of its September-21
low (see chart below). A test of the September-21 low would have required
a gold price in the low-320s if the S&P500 had held above 1070, but
with the S&P500 dropping into the 1040s a gold price of $312 was sufficient.

2. From our perspective the most important
event that occurred during the first half of this week was Tuesday's devastating
suicide bomb attack near Tel Aviv. From the market's perspective the most
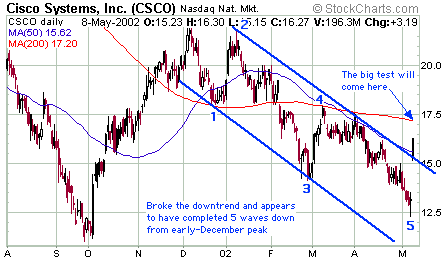
important event was Cisco's latest quarterly report. Cisco's results don't
come remotely close to justifying its current market cap, but Wednesday's
vicious rally is certainly evidence that the stock was dramatically oversold
prior to the report. We follow CSCO quite closely because it tends to be
a leader during both up-moves and down-moves. While we fully expect CSCO
to trade in single digits before the end of this year the stock's chart
provides some evidence that the decline that began in early-December has
ended (see below). The big test will come when the 200-DMA is reached.

3. By spiking to new a yearly low early
this week before rallying sharply on Wednesday the June S&P500
futures have set themselves up to achieve a potentially-important weekly
reversal. To achieve such a reversal they simply need to close this week
above last week's closing level of 1073 (yesterday's close was 1086.50).
There are two things we should see
at the end of this week if this rally has some staying power. Firstly,
the June S&P500 futures will close the week above 1073 as mentioned
above. Secondly, the COT Report released on Friday will show a significant
reduction in the commercial net-short position. Before the end of next
week we should also see another high-volume 'up' day if this is the start
of a 1-3 month rally rather than a short-lived bounce.
At this stage we are skeptical but
prepared to give the bullish case the benefit of the doubt (particularly
since this is the way we were already leaning before yesterday's surge).
We have a number of commodity-cyclical stocks in the Portfolio that are
likely to perform very well during a sustained advance in the overall market
and added QQQ July $35 call options as per the latest Weekly Update (the
options traded below our recommended buy price on Monday and Tuesday).
We'll wait and see how the market finishes the week before making any further
suggestions.
As mentioned in previous commentaries,
if this rally does have some staying power then it is expected to present
us with a wonderful opportunity to add to our medium-term bearish position
at some point over the coming weeks/months.
Stocks, Bonds and the Dollar
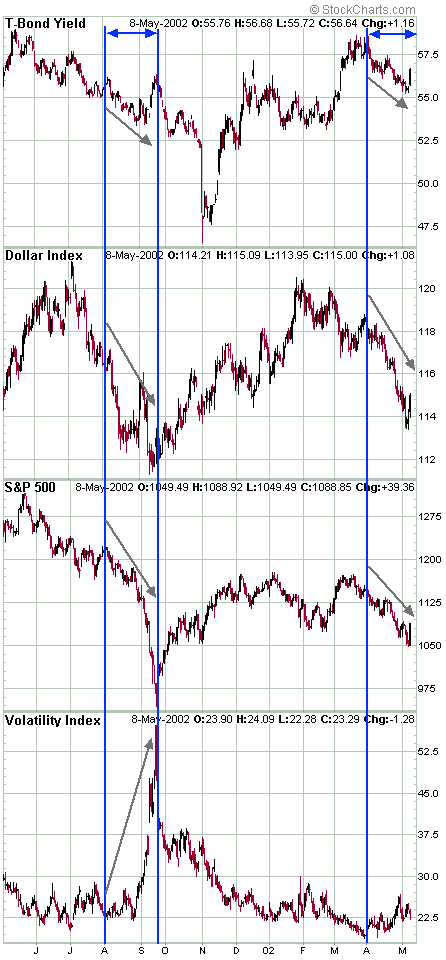
Since the beginning of April the various
financial markets have been moving in ways that are disturbingly similar
to how they moved during August and early-September of last year. We've
attempted to illustrate these similarities on the following chart comparing
the T-Bond Yield, the Dollar Index, the S&P500 and the Volatility Index
(VIX). Note that interest rates, the Dollar and the S&P500 all drove
lower during the 5 week period leading up to September's crisis, while
the VIX remained subdued until the final blow-off decline in the stock
market. Something similar has happened since the beginning of April. As
was the case last August, volatility has moved only marginally higher over
the past several weeks as stocks have fallen. If we get some more 'bullish
confirmation' at the end of this week as discussed above then we won't
worry about another blow-off decline happening at this time. If not then
the following comparison will take on greater significance.

By the way, the above chart shows that
the stock market and long-term interest rates are still spending most of
their time moving in the same direction (a feature of the US credit bubble).
Before the end of this year we expect to see a large decline in stocks
and a concurrent large rise in long-term interest rates.
Gold and
the Dollar
Investing in gold
With the possible exception of Harmony
Gold, the stock of every major gold producer in the world is fully priced
or over-priced based on a gold price near the current level of $310. This
doesn't mean that the stocks won't rise further in the short-term, but
it does mean that buyers at current levels are taking a big risk. They
could certainly be bailed out by a sharp rise in the gold price, but could
also quickly find themselves 20-30% underwater. So, on the basis that gold
has commenced a long-term bull market what action should be taken by someone
who wishes to increase their exposure to gold?
One option would be to buy physical
gold. Many gold stocks are sporting large speculative premiums (they are
discounting a much higher gold price), but gold bullion is still extremely
cheap. Whereas the stocks of the major gold producers are at risk of falling
sharply if the bullion price does not shoot higher in the near future,
we think the downside risk in the bullion price is minimal (we expect gold
to hold above $290 during any pullbacks).
One of the most convenient ways to
buy and store physical gold is via http://www.goldmoney.com/.
The customers of goldmoney.com purchase physical gold in the form of GoldGrams
(GoldGrams are grams of gold stored in a vault) and can use GoldGrams to
make payments via the internet. When you buy GoldGrams you are buying the
ownership rights to part of an allocated, securely-stored, insured private
gold hoard. When GoldGrams are used to make a purchase via the internet
the ownership of the specified amount of gold instantaneously changes hands
while the actual gold remains within the vault. Setting up an account at
goldmoney.com is quick and easy and the costs involved are small (goldmoney.com
charges an annual storage fee of 0.5%). This is certainly a much more cost-effective
way of gaining exposure to physical gold than, for example, investing in
the Central Fund of Canada (a mutual fund that invests in precious metals).
Earlier this week the Central Fund of Canada was selling at a ridiculously-high
23% premium to its net asset value.
From now on GoldGrams can be used to
pay for annual subscriptions to TSI.
Buy and hold?
In the 11th April Interim Update we
included a chart comparison of the Dow Industrials and Homestake Mining
during 1973-1974 to demonstrate that gold stocks can provide excellent
returns during those periods when confidence in the stock market and the
financial system is low/falling. The Dow reached a long-term bottom in
early-October of 1974 and most gold stocks peaked between August and November
of 1974.
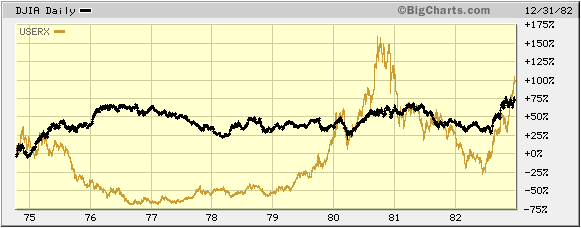
Below is a chart comparing the performance
of the Dow Industrials and the US Global Investors Gold Shares fund (USERX)
from 1st October 1974 until 31st December 1982. Note that:
a) Over the 2-year period beginning
in October of 1974 an investment in USERX fell by around 70% while an investment
in the Dow rose by around 70%.
b) Those who bought gold stocks in
October of 1974 had to wait more than 5 years just to break even on their
investment despite the fact that gold was in a secular bull market throughout
the 1970s.

Using the performances of the Nikkei
in the 1990s and the Dow in the 1930s as templates, the US stock market
is most likely going to reach a long-term bottom some time between October
of 2002 and January of 2003. This is therefore the most likely time for
gold and gold stocks to reach a major high - probably not the ultimate
high but a high that could remain in place for a few years.
The point of the above is that gold
stocks should not be thought of as 'buy and hold' investments, even
if gold happens to be in a secular bull market. We certainly wouldn't want
to be holding a sizeable investment position in gold stocks during a period
similar to 1975-1976.
Current Market Situation
Gold stocks have been strong because
the stock market and the US$ have been weak, so if Wednesday's sharp upward
reversals in the stock market and the Dollar prove to be sustainable then
gold stocks have probably peaked for now and gold will begin a correction
without having first made it into the 320s. However, as noted above we
still need to be convinced regarding the durability of this budding stock
market rally. Furthermore, most gold stocks held up quite well on Wednesday
even as the Dollar and the NASDAQ were surging and the gold price was sliding.
The bottom line is that while we think
gold stocks are close to at least a short-term peak we haven't yet seen
anything in the price action to confirm that a peak has been reached. In
other words, the short-term trend is still up. We will hold onto our few
remaining gold stock trading positions for now. We have not even considered
reducing our core investment position in gold stocks.
Update
on Stock Selections
As noted above we aren't going to make
any additions/changes to the TSI Portfolio until we see how the US stock
market finishes the week, but two stocks we are considering at this stage
are Lucent Technologies in the US and Telstra in Australia. At current
prices (around US$4.60 for LU and A$4.70 for TLS) both stocks represent
good value. They both also look interesting from a technical perspective.
TLS is lower risk due to its profitability and dividend yield whereas LU
offers greater leverage to a stock market and economic recovery.

|

