|
- Interim Update 8th June 2005
Copyright
Reminder
The commentaries that appear at TSI
may not be distributed, in full or in part, without our written permission.
In particular, please note that the posting of extracts from TSI commentaries
at other web sites or providing links to TSI commentaries at other web
sites (for example, at discussion boards) without our written permission
is prohibited.
We reserve the right to immediately
terminate the subscription of any TSI subscriber who distributes the TSI
commentaries without our written permission.
Non-receipt of TSI e-mails
Due to the exponential growth
in the number of junk e-mails flooding the internet many ISP's and
individual mailbox holders are being forced to take increasingly
aggressive actions to block junk -- also known as spam -- e-mails. An
unfortunate side effect of these actions, however, is that there is now
a greater chance of legitimate e-mails being blocked.
Every week we get messages from subscribers reporting that TSI e-mails
have not been received. E-mail delivery is never 100% reliable, but
when the same subscriber consistently misses e-mails the cause is
almost always spam-filtering by the subscriber or by the subscriber's
ISP. However, please remember that you can always access the TSI
commentaries by logging in at the web site regardless of whether or not
you have received the e-mail notification. Except in those cases when
we have provided advance warning of a schedule change our market
updates are posted at the web site within the same 2-hour time window
(5.00am-7.00am US Eastern Standard Time) every Thursday and Sunday.
Also, the date at which the latest update has been posted to the web
site is identified in the "Latest Updates" box at the top right hand
corner of the TSI Home Page (www.speculative-investor.com), so you can always quickly check to see if you've missed anything.
Conundrums
The
conundrum, for us, is the performance of the bond market in relation to
the performances of the stock and commodity markets. ...To be of
genuine value, fundamental analysis must stand alone; that is, it
cannot be a knee-jerk reaction to price action.
Earlier this year Alan Greenspan called the low level of long-term
interest rates a conundrum and this week he said he couldn't explain
why bond yields were at such a low level. In both cases he was
referring to the fact that bond yields have moved lower even though the
Fed has raised the official short-term interest rate many times. This
sort of thing has never happened before, so in that respect we are in
uncharted waters.
From our perspective the performance of bond yields over the past year
is also a conundrum, but for a different reason. Although it is
unprecedented it would not, under certain circumstances, be illogical
for long-term interest rates to move lower from the time the Fed began
pushing short-term rates higher. For one thing, if inflation
expectations were already quite low prior to the first rate hike then a
concerted effort by the Fed to tighten would tend to further suppress
such expectations and perhaps even ignite fears of deflation. Also, as
long as government bond yields in Europe and Japan remained at
ultra-depressed levels it would not be unexpected to see US bond yields
fail to move higher in response to a monetary tightening by the Fed.
The conundrum, for us, is the performance of the bond market in
relation to the performances of the stock and commodity markets.
Specifically, that bond yields could languish near generational lows,
ostensibly in anticipation of an economic slowdown or deflation, at the
same time as growth-oriented markets such as the NASDAQ and
inflation-oriented markets such as copper were very strong. It could be
argued that the bond market is 'seeing' something that the other
markets are not, but this doesn't make sense because bond traders are
no more prescient than the traders of stocks or commodities.
If anything, the conundrum has grown bigger over the past 6 weeks
because stocks and bonds -- all bonds, from low-risk US Treasuries to
relatively high-risk emerging market debt -- have surged in parallel
with a strengthening US dollar. This is a reversal of the inter-market
action that prevailed during 2003-2004. It's like the world's financial
markets are fighting the Fed; the Fed is tightening and over the past
few months this tightening has started to have a significant effect on
the currency market, but while the Fed and the currency market have
been moving in ways that would tend to reduce liquidity the bond market
has been doing its best to BOOST liquidity.
As enigmatic as the bond market appears to be, it is, of course, always
possible to concoct fundamental reasons to explain ANY price action. In
fact, much of what passes for fundamental analysis is just an attempt
to come up with a story that matches the recent price action. Such
'analysis', however, is of no value.
To be of genuine value, fundamental analysis must stand alone; that is,
it cannot be a knee-jerk reaction to price action. Price action can
provide clues as to whether or not a particular piece of fundamental
analysis is on the right track. In particular, an apparent divergence
between price action and the fundamentals should prompt an analyst to
question his/her assessment of the fundamentals. However, such a
divergence, in itself, should never be the primary reason for a change
in an analyst's fundamental outlook because large divergences between
the price action and the fundamentals regularly occur in the financial
markets. Such divergences, in fact, lead to some of the best
money-making opportunities.
It is worth mentioning, as well, that a particular interpretation of
the fundamentals is not necessarily correct just because it happens to
be in synch with the price action. In other words, someone can be right
for the wrong reasons. For example, during the final quarter of last
year you couldn't swing a cat without hitting someone who KNEW that the
huge US current account and budget deficits would result in the US$
continuing along it's downward path. This widely held view looked
absolutely right for a while because it matched the price action, even
though 35 years of historical data indicate that there is no
relationship between the sizes or directions of these deficits and the
dollar's trend over the ensuing 12 months.
The current conundrum will, in all likelihood, be resolved over the
next few months via a collapse in growth-oriented markets; or via a
sharp rise in long-term interest rates; or, most likely, via a
combination of the two (a moderate rise in long-term interest rates in
parallel with weakness in the stock and commodity markets).
The US
Stock Market
General theme for 2005-2006
We've expected that a downturn in confidence would be one of the
dominant themes in the financial markets during 2005-2006. This theme,
in turn, was/is expected to result in those investments that are
generally perceived to be low risk out-performing the investments that
are generally perceived to entail higher risk; or, putting it another
way, to result in safety-oriented investments out-performing
growth-oriented investments.
If we are on the right track with our general theme then some of the things we should see over the coming 18 months are:
a) Strength in the gold price relative to the prices of industrial
metals such as copper, aluminium, nickel and silver. If this relative
strength materialises it will result in the gold/GYX ratio (the gold
price divided by the Industrial Metals Index) trending higher.
Below is a chart illustrating the inverse relationship between gold/GYX
and the S&P500 Index. The chart's message is that rising growth
expectations, as indicated by an intermediate-term upward trend in the
S&P500 Index, will result in gold under-performing the industrial
metals, whereas a downturn in growth expectations will result in the
opposite. Over the past 10 weeks there has been an up-tick in gold/GYX,
but nothing of great significance as of yet. This is not, however, out
of line with the forecasts we made early this year because we didn't
think that a ramping down of growth expectations would gather momentum
until the second half of this year.
A move above 2.0 by the gold/GYX ratio would confirm that we are on the right track.

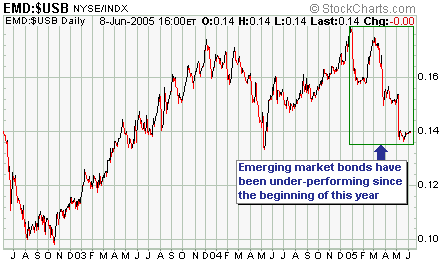
b) Weakness in emerging market government debt relative to US government debt.
The EMD/USB ratio -- the Salomon Brothers Emerging Markets Income Fund
divided by the US T-Bond price -- is a measure of how emerging market
debt is performing relative to US debt. The below chart shows that
there has been a sharp decline in this ratio since the beginning of the
year, indicating a shift in preference towards the lower-risk US
government debt. However, the ratio has been stable since mid-April.
A decisive break by EMD/USB to new lows for the year would support our intermediate-term outlook.
c) Strength in emerging market stocks
The stock markets of the emerging economies of Latin America,
South-East Asia and Eastern Europe were relative strength leaders
during 2003 and during the second half of last year (periods during
which 'investors' threw caution to the wind in a frantic bid to obtain
higher returns). However, in an environment where confidence is
declining and risk aversion is increasing we should see substantial
weakness in the stock markets of these countries.
The below chart shows that EWZ (a proxy for the Brazilian stock market)
surged to a peak at the beginning of March, fell quite sharply during
March-April, and then bounced back to a slightly lower peak. If our
intermediate-term outlook is on the mark then EWZ should break to a new
low for the year within the coming three months.

Current Market Situation
Last week was a likely time for a rebound peak and by some measures
(the S&P500/gold ratio, for example) last week's high was close to
a likely level for a rebound peak. However, although the market action
over the first three days of this week had a bearish bias we don't yet
have any clear evidence that a peak is in place.
As far as the Dow Industrials Index is concerned, initial confirmation
that a peak is in place and that a decline to a new low for the year is
underway would be provided by a daily close below the early-May high
(10400). And once this happens it will, we think, be reasonable to
anticipate a drop to test major support at 9700-9800 over the ensuing
2-3 months.
Gold and
the Dollar
Opinions versus Facts
...a
statement such as "XYZ is in a bull market" will always be an opinion
and never a fact. Furthermore, it is a potentially dangerous opinion
because it might prevent its holder from assessing the current
situation with objectivity.
In an interesting article at http://www.hussmanfunds.com/wmc/wmc050531.htm John Hussman makes the point that "bull" and "bear" labels can only be applied to a market in retrospect. Here's an extract:
"...it's not particularly
useful to ponder whether stocks are in a bull market or a bear market.
Certainly, after the market has moved a large distance in one direction
or another, we can eventually say we've experienced a so-and-so, but as
soon as investors start using those concepts in a predictive way
("stocks are in a bull market, so..."), they become blind to every bit
of conflicting evidence that doesn't come with a swift kick and a hot
poker. Bull markets and bear markets don't exist in real time. Better
to focus on the influences we can actually observe, which include the
level of valuations and the quality of market action."
In other words, a statement such as "XYZ is in a bull market" will
always be an opinion and never a fact. Furthermore, it is a potentially
dangerous opinion because it might prevent its holder from assessing
the current situation with objectivity. If, for instance, we were to
begin all of our analyses with the assumption "gold is in a bull
market" then when it came to gold we would effectively be wearing
blinders. It is a FACT that gold experienced a bull market during
2001-2004, but whether or not gold is in a bull market today is a
matter of OPINION. The main point to take away, though, is that it's
not necessary to have any opinion on whether or not gold is currently
in a bull market. What we know is that under certain financial
conditions gold will generally provide very good returns, so what we
must do is focus on the current conditions and de-emphasise the popular
labels. In this way we stand a good chance of being able to identify
those times when the reward/risk ratio is high and those times when it
is low.
We can further explain the difference between fact and opinion using a couple of gold-related examples.
First, at the bottom of the following monthly chart of the AMEX Gold BUGS Index (HUI) is a momentum indicator known as the MACD.
Notice that a) shortly after the beginning of the HUI's major advance
the faster moving average (the black line) moved above the slower
moving average (the blue line) and remained above it for about 3 years,
and b) downward corrections that occurred during 2001-2003 ended before
the faster moving average was able to move below the slower moving
average. Now, observe the change in the performance of the MACD from
December-2003 -- the time of the HUI's major peak -- to the present
day. In particular, notice that a) a few months after the HUI's
December-2003 peak the black line broke decisively below the blue line
and has remained below it to this day, and b) the only substantial
rally of the past 18 months (the rally that occurred between May and
November of last year) ended before the black line was able to move
above the blue line.
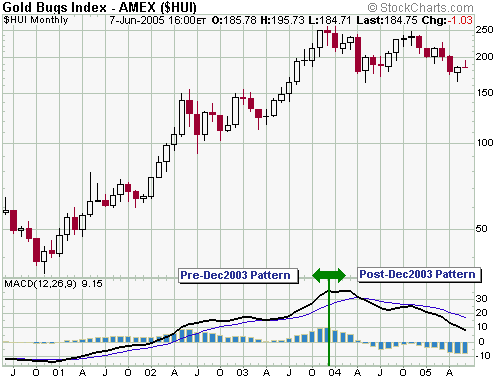
Further to the above,
with respect to the monthly MACD's performance it is a FACT that the
correction that began in December of 2003 is very different to the
corrections that occurred during 2001-2003. This doesn't mean that the
HUI will necessarily plumb considerably lower levels before its next
major advance gets underway (although our OPINION is that it will).
What it means is that any opinion based on the assumption that the
current correction is similar to the corrections that occurred during
2001-2003 has a good chance of being wrong.
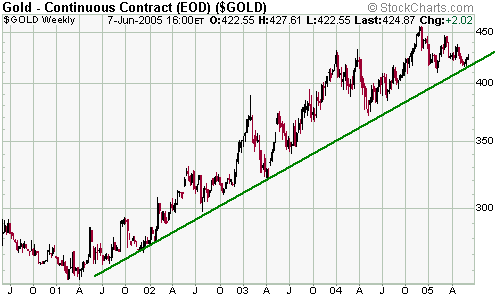
Next, on the below weekly chart of the gold price we've drawn a
trend-line connecting the lows. It's a FACT that the pullback in the
gold price over the past 6 months has not resulted in a break of this
trend-line, but this fact is neither bullish nor bearish because it
tells us nothing about what's likely to happen to the gold price in the
future. It is simply a statement of the obvious. In our OPINION,
however, a break below the trend-line followed by a drop to the 370s
would have BULLISH implications because it would mean that the short-
and intermediate-term downside risk had been significantly reduced.
Current Market Situation
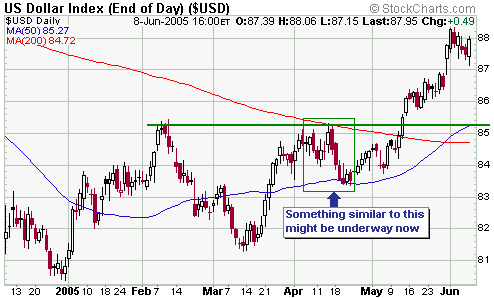
In the latest Weekly Market Update we said that 1-3 weeks of
consolidation were likely in the currency and gold markets prior to a
resumption of the dollar's advance and gold's decline. The below chart
of the Dollar Index shows that the currency market has now been
consolidating for 5 trading days, so nothing surprising is happening at
this stage.
Our best guess is that something along the lines of the consolidation
(pullback in the US$, rebound in the euro) that occurred in April is
currently underway. It probably has further to go, but should not
result in the Dollar Index moving below the support that exists at
85.0-85.5. Our view continues to be that the Dollar Index will move up
to the low-90s before a more substantial pullback becomes probable.
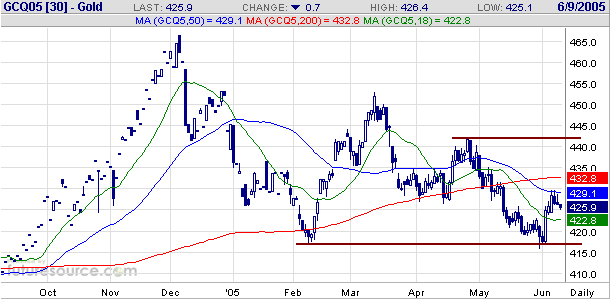
Gold has important
support at around $416 (basis the August futures contract) and
important resistance just above $440. Gold's rebound from its recent
low is probably not over, but we'll be very surprised if it manages to
exceed $440 in the short-term. Our expectation continues to be that
gold will drop to new lows for the year at some point over the next
three months, but the downside risk in the metal does not appear to be
great (no more than 10-15%).
Gold Stocks
In the latest Weekly Update we said: "As
far as the coming 1-3 weeks are concerned, our guess is that the HUI
will consolidate its recent gains and then move a few percent above
last week's high before commencing the next downward leg in its major
correction."
There is no reason to alter this near-term outlook. In particular, if
you take a look at the below daily chart of the HUI and the HUI's RSI
(Relative Strength Index) you will notice that the current rebound
appears to be following a similar pattern to the February-March
rebound. If the similarities persist then we'll get a surge to a new
recovery high before the next downward leg gets underway.
Update
on Stock Selections
 Large
unhedged South African gold stocks Gold Fields Ltd (GFI) and Harmony
Gold (HMY) continue to look interesting to us, particularly during
periods of short-term weakness such as now. GFI appears to be the
better long-term investment, but due to its greater leverage to the
Rand gold price HMY has the greater potential upside. Large
unhedged South African gold stocks Gold Fields Ltd (GFI) and Harmony
Gold (HMY) continue to look interesting to us, particularly during
periods of short-term weakness such as now. GFI appears to be the
better long-term investment, but due to its greater leverage to the
Rand gold price HMY has the greater potential upside.
The fundamentals for these companies have probably turned the corner
due to the recent substantial rebound in the Rand gold price and the
re-structuring efforts that are now largely complete. Unlike the major
North American gold producers, which will probably experience one or
two more quarters profit-margin erosion, GFI and HMY are likely to now
begin reporting improved results. Also, the 'cash crunch' that put so
much downward pressure on the stock price of Harmony earlier this year
has ended.
The industrial relations situation will no doubt create some angst over
the next few months because the standard negotiating tactic of the
mineworkers' union is to ask for a ridiculously high increase in total
compensation and then threaten to go out on strike when the mining
companies refuse to pay-up. If/when this happens it could lead to
another good buying opportunity, but if the Rand gold price continues
to rally it's quite possible that future buying opportunities will
occur at higher levels.
As we keep saying, don't attempt to buy at the absolute bottom.
Instead, continue to average in during the selling squalls over the
remainder of this year.
Chart Sources
Charts appearing in today's commentary
are courtesy of:
http://stockcharts.com/index.html
http://www.futuresource.com/

|

