|
- Interim Update 8th June 2011
Copyright
Reminder
The commentaries that appear at TSI
may not be distributed, in full or in part, without our written permission.
In particular, please note that the posting of extracts from TSI commentaries
at other web sites or providing links to TSI commentaries at other web
sites (for example, at discussion boards) without our written permission
is prohibited.
We reserve the right to immediately
terminate the subscription of any TSI subscriber who distributes the TSI
commentaries without our written permission.
Financial Repression
In a recent interview at King World News
Jim Rickards discusses something called "financial repression", which
is the name given by economist Carmen Reinhart to the strategy of using
"price inflation" (currency depreciation) to reduce the government's
debt. The idea is that if all else remains the same then over a 10-year
period the total debt of the government could be cut in half in real
terms by reducing the purchasing power of the currency at the rate of
4% per year. Both Reinhart and Rickards point out that in going down
this path the government would effectively be reducing the real size of
its debt by stealing from savers and investors.
Because it entails theft, "financial repression" is a terrible and
unjustifiable strategy. But even if we put aside ethical considerations
and look at the situation from the Machiavellian perspective of the
typical politician or central banker, it is still an ill-conceived
strategy because it has no hope of achieving its objective. One reason
is that savers and investors are among the main victims of the theft,
which means that the strategy penalises the main drivers of real
economic growth and will inevitably lead to a slower economy.
Consequently, it will lead to greater dependency on government
handouts, larger government deficits, and an increase in the REAL
magnitude of the government's debt burden.
You don't need a solid foundation in good economic theory to see that
"financial repression" won't reduce the government's indebtedness. This
is because "financial repression" has been practised in the US over
much of the past 50 years, with one result being a dramatic INCREASE in
the size of the government's debt relative to the size of the economy.
Another result has been a very long-term upward trend in the price of
gold relative to the prices of non-monetary commodities. Gold's
long-term upward trend relative to the average commodity stems from the
collective attempt by savers and investors to protect themselves from
the effects of the deliberate inflation policy.
But just because a policy goes against good economic theory and has
been shown in practice to be a complete failure, doesn't mean it won't
be tried in the future. In fact, it is obvious to us that what Carmen
Reinhart calls "financial repression" reflects the current and likely
future approach of the Bernanke-led Federal Reserve. According to the
thinking that dominates Fed policy-making, relentless currency
depreciation is a prerequisite for a healthy economy.
Relentless currency depreciation requires continuous growth of at least
a few percent per year in the money supply, so we can be confident that
the Fed will keep doing whatever it takes to keep the money supply
growing. We can also be confident that this relentless inflation will
curtail the US economy's progress and lead to greater, not lesser,
government indebtedness.
Another explanation for why banks aren't lending
In the 30th May Weekly Update we wrote:
"The fact that banks
haven't done more with their "excess reserves" up until now suggests
that they are being prevented from doing so by a reduction in the
private sector's desire to take on debt, or by financial constraints
such as large, but as yet unreported, holes in their balance sheets."
Another factor that could be contributing to banks' reticence to make
more profitable use of their "excess reserves" is the possibility that
they will be forced by the Fed to substantially increase the amount of
capital they hold as a percentage of their assets. This possibility is
discussed in the WSJ article posted HERE.
If capital requirements were made more stringent it wouldn't
necessarily curtail the investing and trading activities of banks, but
it would likely make them even more risk averse than they are right
now; in which case there would probably be less investing in
traditional loans/leases and more investing in Treasury securities.
It is becoming increasingly clear that whether or not the private
banking system turns out to be an inflationary or a deflationary force
over the coming 12 months will largely depend on the volume of Treasury
debt it purchases. To put it another way, it is becoming increasingly
likely that the private banking system will continue to reduce its
collective loan book over the coming 12 months, which means that to be
a net booster of the total money supply it will have to monetise a lot
of Treasury debt.
The Stock Market
Current Market Situation
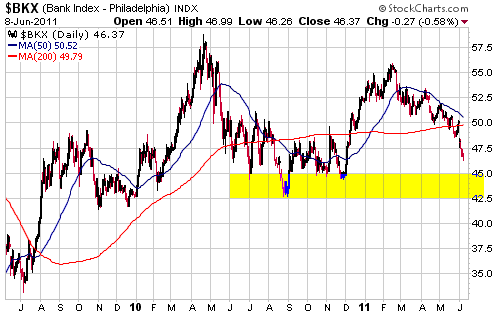
The large-cap US bank stocks, as represented by the BKX, made a new low
for the year on Wednesday and have been very week on both an absolute
and a relative basis since February. Support at 42.5-45.0 probably
defines the BKX's short-term downside risk.
Considering the amount of monetary and regulatory help provided to the
banks by the Fed and the Treasury over the past 2.5 years, the relative
weakness in the bank stocks is remarkable. Just imagine where these
stocks would now be trading if trillions of dollars of direct and
indirect support hadn't been channeled from the rest of the economy
into the banking industry. Many of them wouldn't be trading at all.
We don't view the relative weakness of the banks as a major problem for
the US stock market or the US economy. The real problem is that the Fed
and the government won't allow the largest banks to fail, which means
that when the financial difficulties of these corporations again become
life-threatening they will receive another massive transfusion of
wealth, with the productive sectors of the economy being involuntary
donors.
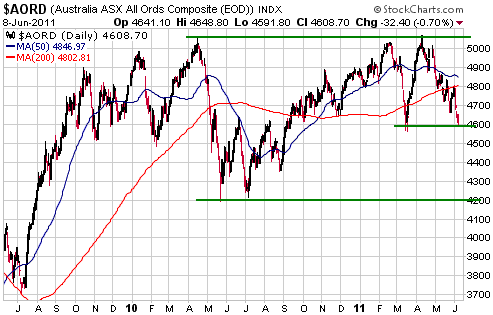
Australia's All
Ordinaries Index appears to have 'double-topped' in April of 2010 and
April of 2011. Support at around 4200 looks like a reasonable downside
target for the second half of this year, but right now the market is
very 'oversold' on a short-term basis and will probably soon begin to
rebound. A routine counter-trend rebound would take it back to around
4800.
The S&P500 Index
has just fallen for six days in succession and is now 'oversold' on a
short-term basis. If it can drop to important support at 1250 within
the next fortnight then the stage will probably be set for a multi-week
rebound.
Chinese Stock Frauds
Many North-America-listed Chinese companies have been accused of
engaging in fraudulent practices, such as deliberately overstating
revenues. This has caused their stocks to plunge in price and in some
instances to be suspended from trading or de-listed. A lot of the
accusations that are flying around have not yet been substantiated, but
sufficient 'accounting shenanigans' have been exposed to date to cause
investors to dump their shares at the first scent of something not
being quite right.
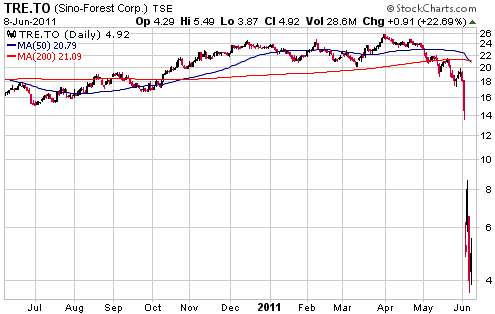
The most recent example is the Toronto-listed Sino-Forest (TSX: TRE).
TRE has internationally-respected people on its board and has the past
decade's most successful hedge fund manager (John Paulson) as its major
shareholder, but this didn't prevent its stock from being 'trashed' in
reaction to a report from "Muddy Waters" claiming that the company is a
massive fraud. After trading above $19 just six days ago, TRE traded as
low as $3.67 on Tuesday.
"Muddy Waters" (MW),
a research and stock-trading firm that takes positions in stocks ahead
of publicising its research with the aim of benefiting from the market
reaction to the research, has been linked to several
North-America-traded Chinese companies accused of fraud. The veracity
and thoroughness of MW's research is questionable, but it has garnered
credibility because genuine problems have come to light in some of the
companies it has targeted.
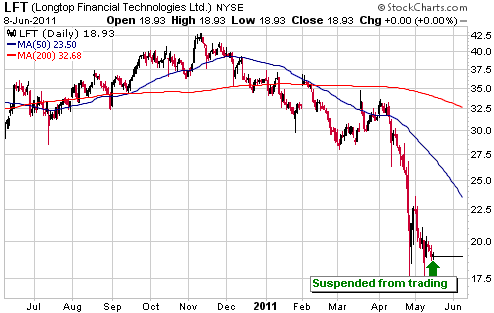
That being said, MW was not involved with one of the most extraordinary
of the Chinese fraud stories. We are referring to Longtop Financial
Technologies (LFT), the shares of which tanked and were then suspended
from trading in response to a damning letter from the company's auditor
(Deloitte). LFT was backed by major hedge funds and investment banks
(including Goldman Sachs), and yet it proved to be a fraud. What makes
this case so extraordinary is that the company's bank helped perpetrate
the fraud by providing false information to the auditor. More details
can be found in the article posted HERE.
As most of our
readers know, we were directly affected by the above-mentioned Chinese
fraud saga thanks to having speculated in the shares of Duoyuan Global
Water (DGW). The extent to which DGW overstated the size of its
business is yet to be confirmed, but the company's actions (or lack of
action in response to serious allegations) over the past several weeks
point to significant problems. We don't know how the DGW story will
unfold from here, but we see no good reason to be optimistic.
In China, financial fraud is a crime punishable by death. However, it
seems that this only applies when the cheating is done in China and the
victims are local Chinese.
Gold and
the Dollar
Gold and Silver
Gold still has the potential to make a final surge to a new high before
commencing an intermediate-term correction, but time is running out. In
our opinion, this potential would be eliminated by a daily close below
$1520.
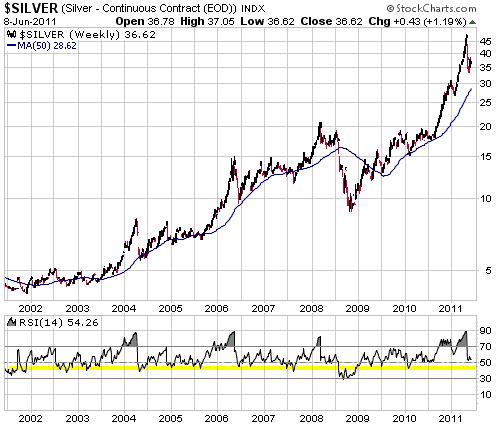
In addition to showing the weekly price performance of silver over the
past 10 years, the following chart shows silver's 50-week moving
average and weekly RSI. Notice that no intermediate-term correction in
the silver market over the past 10 years has ended until a) the silver
price has traded at or below its 50-week moving average AND b) the
weekly RSI has dropped to 45 or lower.
In the current situation the 50-week moving average is rising, which
means that it would be possible for silver to reach this moving average
by trading sideways over the next three months. However, if silver
spends the next three months trading sideways its RSI won't become as
'oversold' as it has during all prior intermediate-term corrections.
In order for both the moving average and RSI requirements to be met,
the silver price will probably have to drop back to at least the
high-$20s within the coming month or so.
Gold Stocks
Political Risk
As a result of Ollanta Humala's victory in Peru's presidential
election, the gold sector of the stock market was weaker over the past
three trading days than it otherwise would have been. The market's fear
is that the left-leaning Humala will follow in the footsteps of
Venezuela's Hugo Chavez, so gold and silver mining companies with
important assets in Peru were aggressively marked down. Due to the fact
that many gold and silver mining companies -- including gold-mining
majors NEM and GFI -- have important assets in Peru, this political
development had a significant adverse effect on the overall sector.
However, the adverse effect didn't alter the short-term trend (which
was already down) or any of our expectations (we were already
anticipating a decline to new multi-month lows).
None of the current TSI stock selections have any exposure to Peru, but
we aren't opposed to adding some exposure to this country if the price
is right. The country risk is now higher, but we don't mind taking risk
provided that we get well paid for doing so. Also, we suspect that
Humala's 'bark' will turn out to be worse than his 'bite'.
Along more general lines, the political situation in Peru relates to
why gold mining stocks have been under-performing gold bullion. As
political risk increases, gold bullion stored safely in a vault in
Zurich looks increasingly attractive relative to gold stored under the
ground in countries where the government has an anti-free-market agenda.
Stock Averages versus Individual Stocks
Price indices are, by definition, averages, and the average of a group
of numbers can be very different from most of the numbers in the group.
For this reason it is not uncommon for the performance of a stock-price
index to be very different from the performances of most of the index's
component stocks. Such is the case with the gold-stock indices and
their components.
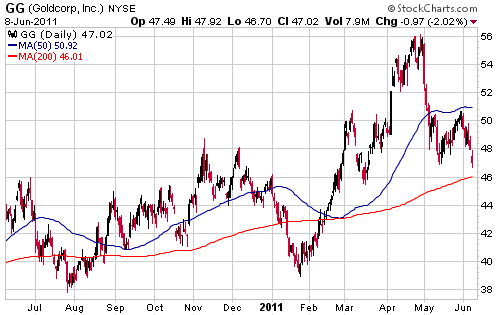
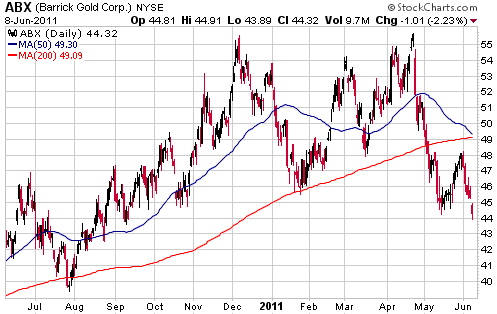
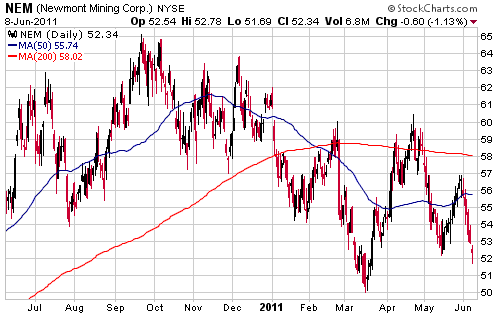
For example, Goldcorp (GG), Barrick Gold (ABX) and Newmont Mining (NEM)
have the largest weightings in the HUI and together account for about
40% of this index, so the average of the three stocks should
approximate the HUI. However, the following charts show that these
stocks have performed very differently from each other over the past 9
months, which means that the chart of at most one of these stocks will
resemble the chart of the HUI.
The following charts show that: GG rocketed upward to an all-time high
at the end of April-2011 and then plunged, ABX double-topped in
early-December of 2010 and late-April of 2011, and NEM has been
trending downward since last September. Averaging out these very
different performances creates something that looks like the HUI.
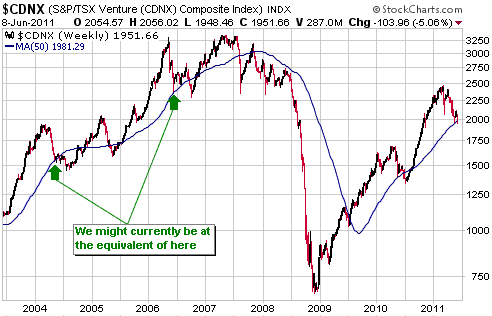
Current Market Situation
Displayed below is a weekly chart of the TSX Venture Exchange Composite
Index (CDNX). The CDNX is a reasonable proxy for junior resource stocks
(the gamut of junior resource stocks, not just junior gold stocks).
The CDNX has been trending downward since late February. Not
coincidentally, the CDNX's downward trend has coincided with a widening
trend in credit spreads. We say "not coincidentally" because both
trends are symptoms of a widespread shift away from risk (increasing
risk aversion).
Based on the assumption that the CDNX's performance during the
intermediate-term corrections of 2004 and 2006 is an appropriate model
for the current correction, we conclude that:
a) The CDNX hasn't yet made its ultimate correction low
b) The CDNX's ultimate correction low will be within 10% of its current level
c) The CDNX will return to the vicinity of its early-2011 high by the first quarter of next year
The HUI broke below
its May low on Wednesday, a development that shouldn't have come as a
surprise to TSI readers. As is the case with the CDNX, the HUI probably
hasn't yet reached its ultimate correction low but is probably within
10% of it. Given that the HUI has just declined for six days in a row
and is now 'oversold', the downward trend should soon be interrupted by
a multi-day rebound.
Speculators in gold stocks should have low expectations with respect to
the next few months. The gold-stock indices could bottom out this
month, but seasonal/cyclical influences suggest that the next
intermediate-term upward trend won't commence until October-November at
the earliest. Also, gold stocks will have to deal with a 10% pullback
in the gold price at some point, and the general shift away from risk
is likely to weigh on the shares for a while longer.
Our plan is to SLOWLY put cash to work in the gold sector as opportunities arise over the months ahead.
Currency Market Update
Our view continues to be that the Dollar Index is pulling back to
'test' its May low as part of an intermediate-term bottoming process.
This view meshes with the idea that the stock market is in the process
of forming an intermediate-term top.
Update
on Stock Selections
(Notes: 1) To review the complete list of current TSI stock selections, logon at http://www.speculative-investor.com/new/market_logon.asp
and then click on "Stock Selections" in the menu. When at the Stock
Selections page, click on a stock's symbol to bring-up an archive of
our comments on the stock in question. 2) The Small Stock Watch List is
located at http://www.speculative-investor.com/new/smallstockwatch.html)
Chart Sources
Charts appearing in today's commentary
are courtesy of:
http://stockcharts.com/index.html

|