![]()
![]()
![]()
![]()
- Interim Update 8th June 2016
Copyright
Reminder
The commentaries that appear at TSI
may not be distributed, in full or in part, without our written permission.
In particular, please note that the posting of extracts from TSI commentaries
at other web sites or providing links to TSI commentaries at other web
sites (for example, at discussion boards) without our written permission
is prohibited.
We reserve the right to immediately
terminate the subscription of any TSI subscriber who distributes the TSI
commentaries without our written permission.
CBCCFLAW
A lot of good economic theory
boils down to the acronym
TANSTAAFL, which stands for "There Ain't No Such Thing As A Free Lunch".
TANSTAAFL is an unavoidable law of economics, because everything must be paid
for one way or another. Furthermore, attempts by policymakers to get around this
law invariably result in a higher overall cost to the economy. Unfortunately,
central bankers either don't know about TANSTAAFL or are naive enough to believe
that their manipulations can provide something for nothing. They seem to believe
that the appropriate acronym is CBCCFLAW, which stands for "Central Banks Can
Create Free Lunches At Will".
ECB chief Mario Draghi is the leader in applying policies based on CBCCFLAW.
Despite his economic stimulation measures having a record to date that is
unblemished by success, he has just launched new attempts to conjure-up a free
lunch.
We are referring to two measures that were announced in March and are now
beginning to be implemented, the first of which is the ECB's corporate
bond-buying program (starting this week the ECB will be monetising
investment-grade corporate bonds in addition to government bonds). This program
is designed to bring about a further reduction in interest rates, because, as we
all know, if there's one thing that's holding Europe back it's excessively high
interest rates, where "excessively high" means above zero.
Unlike the situation in the US, very little corporate borrowing in Europe is
done via the bond market. The ECB's new corporate bond-buying program is
therefore unlikely to provide even a short-term boost, but, not to worry, that's
where the ECB's second measure comes into play.
The ECB's second measure is a new round of a previously-tried program called the
Targeted Long Term Refinancing Operation (TLTRO). Under the TLTRO program,
commercial banks get encouraged -- via a near-zero or negative interest rate --
to borrow money from the ECB on the condition that the banks use the money to
make new loans to the private sector.
The combination of the ECB's two new measures is supposed to promote credit
expansion and higher "inflation". In other words, to the extent that the
measures are successful they will result in more debt and a higher cost of
living. In Draghi's mind, this would be a positive outcome.
In the bizarre world occupied by the likes of Draghi, Yellen and Kuroda, the
failure of an economy to strengthen in response to a policy designed to
stimulate growth never, ever, means that the policy was wrong. It always means
that not enough was done. It's not so much that these central planners refuse to
see the flaws in their policies, it's that they cannot possibly see. They cannot
possibly see because they are looking at the world through a Keynesian lens. As
we've noted in the past, trying to understand how the economy works using
Keynesian theory is like trying to understand the movements of the planets using
the theory that everything revolves around the Earth.
So, the worse things get in response to counter-productive 'economic
stimulation' policies, the more aggressively the same sorts of policies will be
applied and the worse things will eventually get. We've referred to this as the
Keynesian death spiral.
Natural Gas (NG) is
close to signaling a multi-year trend reversal
In the 20th April Interim Update
we wrote that NG's days of being a laggard were probably over. We also wrote: "There
is substantial resistance at $2.30-$2.50 that will have to be overcome on a
weekly closing basis to signal a major trend reversal, but this week's price
action is probably an early warning that NG has joined an expanding list of
commodities that have turned the corner."
The NG price subsequently pulled back from its 200-day MA to its 50-day MA and
then resumed its rally. As illustrated below, it has since broken above its
200-day MA but still needs to overcome the critical lateral resistance at
US$2.50 (on a weekly closing basis) to signal a reversal of at least
intermediate-term importance.
The Stock Market
The US
The 2000-2001 Comparison
The comparison of 2015-2016 with 2000-2001 appeals to us. Then, like now, the US
economy was widely viewed as a haven in a sea of economic weakness, the US stock
market was dominated by a relatively small number of high-flying tech stocks,
the Fed had half-heartedly tried to tighten monetary policy, gold and the
gold-mining sector were in process of reversing long-term declines, and the US$
was nearing a major peak. Furthermore, except for the indices that were most
directly affected by the tech/internet bubble, the price action since early-2015
has a lot in common with the price action during the period from early-2000
through to May-2001. The similarities between the two periods are indicated on
the following monthly chart of the Dow Industrials Index.
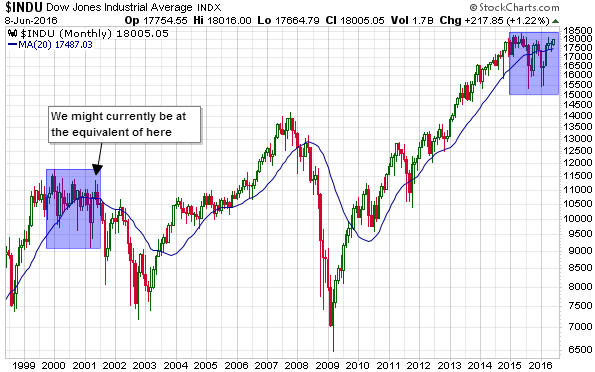
Despite the recent strength, when we take a wide-angle view the price action of
2015-2016 still looks like the price action of 2000-2001. However, as discussed
below there are signs that the current market is deviating from the expected
bear-market path.
A put/call sell signal, but a bearish divergence eliminated
In the latest Weekly Update we wrote:
"...due to the recent plunge in the 10-day MA of the equity put/call ratio
there is now the potential for the put/call situation to soon generate a BEARISH
signal. What it would take is a small additional decline in the equity put/call
(to below 0.60) combined with a rise in the OEX put/call to at least 2.0."
The following chart shows that the equity put/call has now dropped below 0.60
and that the OEX put/call has moved above 2.0. This means that we now have a
put/call sell signal, which is a short-term warning of downside risk.
At the same time, an important bearish divergence has just been removed. We are
referring to the fact that the number of individual NYSE common stocks making
new 52-week highs (the green bars on the middle section of the following chart)
has finally exceeded its March high.

Also worth noting is that the S&P500 Index (SPX) has just closed above its
November-2016 high and the Dow Transportation Average (TRAN) has just closed
above its 50-day MA, although the SPX's breakout still needs to be confirmed by
the weekly close and the NASDAQ100 Index (NDX) still has an unbroken sequence of
declining tops since last November (see chart below).
The upshot is that while the sentiment situation (the put/call sell signal) is
warning of short-term downside risk, unless there is a downward reversal over
the final two days of this week the technical evidence will, on balance, have
shifted against the bear-market scenario.
The odd man out
On the global stage the US stock market (as represented by the SPX) is the 'odd
man out'. This is evidenced by the following two charts, the first of which is a
proxy for European stocks and the second of which is a proxy for Japanese
stocks. The European and Japanese stock markets have been performing very
similarly to each other and very differently from the US stock market.
This can't continue. Either the US market will soon fall into line with the
others or the European and Japanese markets will soon get a lot stronger.

Gold and the Dollar
Gold
Gold, T-Bonds, equities and industrial commodities are currently rallying
together. Like the bullish action in the US stock market in parallel with
bearish action in the European and Japanese stock markets, this can't continue.
In the latest Weekly Update, we wrote:
"...gold survived a few tests of lateral support in the low-$1200s last week
before reversing upward in spectacular fashion in response to the downgrading of
rate-hike expectations prompted by the dismal US employment data. Moreover, it
managed to reach in a single day the upside target (the $1240s) that we had in
mind for a 1-3 week rebound. This probably means that the rebound will exceed
our target.
Our best guess, now, is that the rebound will extend to around $1280, where
there is significant lateral resistance defined by the March high. First,
though, the gold market will have to deal with the 50-day MA, which is where the
price peaked on Friday."
The US$ gold price traded sideways near its 50-day and 20-day MAs during the
first two days of this week before resuming its rebound on Wednesday. Lateral
resistance at $1280 remains the most likely level for a rebound peak.
Gold Stocks
The HUI built on last Friday's moon-shot over the first three days of this week
and made a marginal new high for the year on Wednesday (with gold bullion about
$40 below its 2016 high), but hasn't yet been able to close above its 2nd May
peak of 236.
As long as it holds above its 20-day MA (at 215 and rising) during any pullback
over the days ahead it will remain positioned to break decisively to a new high
for the year prior to an intermediate-term peak.
The Currency Market
It's a strange world when evidence that the US economy is weak causes strength
in commodity prices, but that's the world we live in. Evidence of US economic
weakness causes increased speculative enthusiasm for commodities because
traditional price discovery has been supplanted by anticipation of what the
monetary central planners are going to do next. So, a 'shockingly' bad report on
US employment causes speculators to anticipate an easier Fed and to jump into
any asset/investment that is perceived to benefit from US$ weakness and higher
"inflation".
When commodities are the flavour of the day it's normal for the A$ and the C$,
the main 'commodity currencies', to be relatively strong. It therefore isn't
surprising that the market action of the past few days has included strong
rebounds in the A$ and the C$.
The question is: Did the change in Fed rate-hike expectations prompted by last
Friday's US employment news bring the A$ and C$ corrections to premature ends?
We suspect that the answer is no and that the corrections will soon resume, but
we obviously can't be sure. If it turns out that the corrections in the
commodity currencies did end last week then the main reason to expect sizable
declines in commodity prices over the coming 1-2 months will have been removed.
This is because the commodity currencies tend to lead commodities at important
turning points.
Updates on Stock Selections
Notes: 1) To review the complete list of current TSI stock selections, logon at
http://www.speculative-investor.com/new/market_logon.asp
and then click on "Stock Selections" in the menu. When at the Stock
Selections page, click on a stock's symbol to bring-up an archive of
our comments on the stock in question. 2) The Small Stock Watch List is
located at http://www.speculative-investor.com/new/smallstockwatch.html
Chart Sources
Charts appearing in today's commentary
are courtesy of:
http://stockcharts.com/index.html
![]()