![]()
![]()
![]()
![]()
- Interim Update 8th July 2020
Copyright
Reminder
The commentaries that appear at TSI
may not be distributed, in full or in part, without our written permission.
In particular, please note that the posting of extracts from TSI commentaries
at other web sites or providing links to TSI commentaries at other web
sites (for example, at discussion boards) without our written permission
is prohibited.
We reserve the right to immediately
terminate the subscription of any TSI subscriber who distributes the TSI
commentaries without our written permission.
Industrial Commodities
The Natural Gas 'double
bottom'
A week ago we wrote that the natural gas (NG)
price had just reversed upward after testing its April low, which was
preliminary evidence that it may have set a cycle low via a double bottom.
Some additional upward progress has since been made, but the price remains
within its 6-month trading range. Additional preliminary evidence that a
cycle low is in place would be provided by a daily close above the 200-day
MA (slightly above US$2.00 on the following chart), while a weekly close
above the early-May high would be definitive.
The current rebound in the NG price is happening in the face of
bearish fundamentals. In particular, the large contango in the NG futures
market tells us that currently there is a substantial surplus of the
physical commodity in the US. However, we continue to anticipate a
tightening of the market within the next several months. This is partly
due to an increase in demand as the economy opens up and as government
efforts are made to boost economic activity ahead of the November
election, but it is mainly due to the decline in production that should
stem from the large decline in drilling activity that has already
occurred.
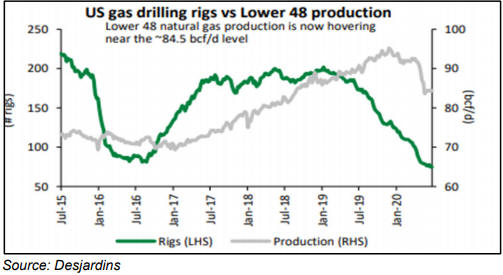
Displayed below is a chart from the latest Peyto
Exploration and Development (PEY.TO)
President's Report showing the trends in NG production (the grey line)
and the number of drilling rigs (the green line). Notice that the grey
line follows the green line with a substantial lag. NG production began to
decline late last year and, based on the drilling rigs trend probably will
decline over the remainder of this year.
Oil threatens to break out to the upside
The
oil price and the US stock market have been positively correlated over the
past 2-3 years. This relationship is illustrated by the following daily
chart, which shows the oil price in black and the S&P500 Index (SPX) in
red.
The chart reveals two notable 4-6 week divergences. The first
occurred during January-February when the SPX continued to rally while the
oil price began to trend downward, and the second occurred in March-April
when the oil price crashed to a new multi-year low while the SPX extended
its upward trend. However, after each of these divergences the markets
quickly moved back into line with each other.
We are revisiting the oil-SPX relationship today because it relates to
our short-term (1-3 month) outlook for oil.
The following daily
chart shows that the oil price essentially has traded sideways since
rising to the $40-$42 resistance range in early-June. We are expecting
resistance at $42 to hold and for the market to experience a $5-$10
correction in the short-term, but for this to happen there probably will
have to be a meaningful short-term correction in the US stock market. If
there isn't and instead the SPX makes a solid break above its early-June
high, then the oil price probably will breach resistance at $42 and rise
to the mid-to-high $40s.
Is the uranium correction over?
In mid-April
we wrote that uranium (and the associated mining stocks) probably had
commenced a cyclical bull market, and near the end of April we wrote that
a short-term correction was likely. The first short-term correction in a
new bull market often ends near the 50-day MA, although it isn't uncommon
for the price to fall as far as the 200-day MA before the longer-term
upward trend resumes.
In the 22nd June Weekly Update we noted that
Cameco (CCJ), the world's second-largest uranium producer, had reached its
50-day MA and may have completed its correction, but at that time there
was still a risk that the short-term price decline would extend to the
200-day MA. There will be room for uncertainty until CCJ makes a solid
break above US$11.00, but over the first two days of this week the
probability increased that the correction is complete. If it is complete
then resistance at US$13 is a logical short-term target.
Due to the preliminary evidence that the uranium correction is over we
are going to add a new uranium-related speculation to the TSI List. We
have chosen Energy Fuels (NYSE: UUUU, TSX: EFR), because the company:
a) Has a strong balance sheet, with US$35M of working capital and no
long-term debt.
b) Offers leverage to an increase in the uranium
price by virtue of its ability to quickly ramp up production in response
to a higher uranium price and its substantial in-ground resources.
c) Immediately benefits financially from a higher uranium price due to
having 520K pounds (worth about US$17M at today's price) of saleable
uranium in its inventory.
d) Is based in the US, which puts it in a
position to benefit from US government efforts to increase the security of
uranium supply.
e) Offers exposure to vanadium in addition to
uranium.
The company has conventional uranium mines and the only
fully-functional conventional uranium mill in the US. It also owns ISR (in
situ recovery) uranium projects in the US. However, it has no current
production due to having placed its operating mines on
care-and-maintenance pending a higher price for the commodity.
The
company has 115M shares outstanding, giving it a market cap of US$185M at
Wednesday's closing price of US$1.61.
The following daily chart
shows that UUUU has been in correction mode since late-April. There is no
evidence in its price action that the correction is over, but if CCJ's
correction is complete then so, in all likelihood, is UUUU's.
UUUU
has been added to the TSI List at US$1.61 as a trade with an expected
duration of 6-12 months. We will use a 20% trailing stop loss (TSL), which
means that the initial daily-closing stop will be at US$1.28.
At current prices the lowest-risk way to obtain exposure to uranium is
to buy the Uranium Participation Fund (U.TO), a fund that holds physical
uranium. At its closing price of C$4.93 on Wednesday 8th July this fund
was trading at a 15% discount to its net asset value.
The Stock Market
Our Equity True Fundamentals
Model (ETFM), which had been bearish since February, shifted to neutral at
the end of last week. Given the magnitude of the stock market's rally from
the March-2020 low this is a belated signal, but it supports our view that
the SPX will not revisit its March-2020 low over the remainder of this
year and that the realistic worst-case scenario is a correction that
retraces about half of the March-June up-move.
Depending on which
market proxy you use, you could make the case that the US stock market has
been in correction mode for about a month or is yet to enter correction
mode. For example:
1) The NASDAQ100 Index (NDX) made its most
recent all-time high on Tuesday of this week and clearly has not yet begun
to 'correct'. Notice that all pullbacks since late-April have ended
at/near the 20-day MA, so a solid break below the 20-day MA will signal
that a correction has begun.
2) The S&P500 Index (SPX) pulled back to its 200-day MA last month and
remains below the rebound high made in early-June, but it is yet to
experience a correction worthy of the name.
3) The Dow Industrials Index broke below its 200-day MA about a month
ago and appears to be in correction mode.
4) The NYSE Composite Index (NYA), a better proxy for the overall
market than any of the indices mentioned above, barely made it up to its
200-day MA last month before reversing course. At the close of trading on
8th July it was 15% below its January-2020 all-time high and 5% below its
June-2020 post-crash rebound high.
We expect further corrective activity, or in the case of the NDX the
start of a correction. However, it's possible that due to additional
support from both the Fed and the government over the next few months,
instead of getting significant weakness in the broad market we will get a
rotation involving a shift from 'growth' (best represented by the NDX) to
some of the sectors that already experienced meaningful corrections (for
example, banks and energy).
Gold and the Dollar
Gold and Silver
The Ratio
Gold is more
money-like and silver is more commodity-like. Consequently, the
relationships that we follow involving the gold/GNX ratio (the gold price
relative to the price of a basket of commodities) also apply to the
gold/silver ratio. In particular, gold, being more money-like, tends to do
better than silver when inflation expectations are falling (deflation fear
is rising) and economic confidence is on the decline.
Anyone armed
with this knowledge would not have been surprised that the collapse in
economic confidence and the surge in deflation fear that occurred during
February-March of this year was accompanied by a veritable moon-shot in
the gold/silver ratio*. Nor would they have been surprised that the
subsequent rebounds in economic confidence and inflation expectations have
been accompanied by strength in silver relative to gold, leading to a
pullback in the gold/silver ratio. The following charts illustrate these
relationships.
The first chart compares the gold/silver ratio with
the IEF/HYG ratio, an indicator of US credit spreads. It makes the point
that during periods when economic confidence plunges, the gold/silver
ratio acts like a credit spread (credit spreads rise (widen) when economic
confidence falls).
The second chart compares the silver/gold ratio
(as opposed to the gold/silver ratio) with the Inflation Expectations ETF
(RINF). It makes the point that silver tends to outperform gold when
inflation expectations are rising and underperform gold when inflation
expectations are falling.
We are expecting a modest recovery in economic confidence and a big
increase in inflation expectations over the next 12 months, meaning that
we are expecting the fundamental backdrop to shift in silver's favour. As
a result, we are intermediate-term bullish on silver relative to gold. We
don't have a specific target in mind, but, as mentioned in the 16th March
Weekly Update when the gold/silver ratio was 105 and in upside blow-off
mode, it isn't a stretch to forecast that at some point over the next
three years the gold/silver ratio will trade in the 60s.
Be aware
that before silver commences a big up-move in dollar terms and relative to
gold there could be another deflation scare. If this is going to happen it
probably will do so within the next three months, although we hasten to
add that any deflation scare over the remainder of this year will be far
less severe than what took place in March.
*The
gold/silver ratio hit an all-time intra-day high of 133 and daily-closing
high of 126 in March of this year. This was one of the many unprecedented
market/economic events of 2020.
The
recent price action
The following daily chart shows that the
US$ gold price has broken above lateral and round-number resistance at
$1800. Surprisingly, this happened to minimal fanfare. Almost all
attention, it seems, is focused on the likes of Amazon (AMZN) and Apple
(AAPL). This is a plus because it implies that the 'unwashed masses',
which obviously don't include any TSI subscribers, are yet to become
enamoured of gold.
The retail investing herd becoming enamoured of
gold is something that's likely to happen over the next 12 months --
beginning after the FAANG bubble springs a leak. We expect that during the
same period the herd also will become very enthusiastic about industrial
and agricultural commodities. In fact, on an intermediate-term basis we
are more bullish on the likes of zinc and nickel than we are on gold, but
the short-term risk/reward favours gold.
Note that the break above
US$1800 still has to be confirmed by the weekly close. It also has to be
confirmed by the euro gold price, which is still below its April high.
Our guess is that the US$ gold price will make a multi-week top within
the coming week or so, pull back to either its 20-day MA or its 50-day MA,
and then resume its upward trend.
The US$ silver price has
achieved a daily close above resistance at $19.00. This resistance capped
the upside in January, February and May of this year, so the breakout is
significant. But as is the case with gold, the breakout requires
confirmation from the weekly close.
Gold Stocks
The HUI closed above long-term
resistance at 286 (the 2016 high) on Tuesday of last week and above
short-term resistance defined by its May-2020 high on Tuesday of this
week, meaning that it has just made a new 7-year high. This is more
evidence that we are dealing with the completion of a long-term base that
projects much higher prices over the coming year or two, regardless of
what happens over the next few weeks.
Importantly, this week's move to a new multi-year high was confirmed
by the HUI/gold ratio. The following daily chart shows that the HUI/gold
ratio held above its 150-day MA during the May-June decline, thus keeping
the decline within the bounds of a routine short-term correction, and has
just (on Wednesday 8th July) moved above its May high.
With regard to the HUI's short-term prospects, our guess is the same
as it is for gold bullion. We suspect that there will be a multi-week top
within the coming week or so followed by a pullback to either the 20-day
MA or the 50-day MA, after which the upward trend should resume. Downside
risk will become much greater if the upward trend continues until
September with only minor interruptions along the way, but we'll cross
that bridge if/when we come to it.
The Currency Market
The Dollar Index (DX) made a minor downside breakout over the first
three days of this week. We are referring to the break below the bottom of
the short-term channel drawn on the following daily chart. However, on a
risk/reward basis there hasn't been a significant change.
We expect
that over the next two months the DX will trade 'choppily' between 94.5
(its March-2020 low) and 98.5. In other words, we expect that it will
trade at its current level +/- about 2 points. This is due to the likely
effects of countervailing forces, with a shift away from risk putting
upward pressure on the DX at some point and the on-going profligacy of
both the Fed and the US government maintaining downward pressure on the
DX.
The direction of the next big move is more likely to be down
than up due to the downward forces mentioned above as well as the US stock
market becoming a global laggard.
Updates on Stock Selections
Notes: 1) To review the complete list of current TSI stock selections, logon at
http://www.speculative-investor.com/new/market_logon.asp
and then click on "Stock Selections" in the menu. When at the Stock
Selections page, click on a stock's symbol to bring-up an archive of
our comments on the stock in question. 2) The Small Stock Watch List is
located at http://www.speculative-investor.com/new/smallstockwatch.html
Chart Sources
Charts appearing in today's commentary
are courtesy of:
https://stockcharts.com/
![]()