|
- Interim Update 8th August 2012
Copyright
Reminder
The commentaries that appear at TSI
may not be distributed, in full or in part, without our written permission.
In particular, please note that the posting of extracts from TSI commentaries
at other web sites or providing links to TSI commentaries at other web
sites (for example, at discussion boards) without our written permission
is prohibited.
We reserve the right to immediately
terminate the subscription of any TSI subscriber who distributes the TSI
commentaries without our written permission.
Questioning our
long-term bearish outlook for T-Bonds
In addition to citing empirical evidence that supports our view of the counterproductive nature of "stimulus" programs, a recent
article by Hoisington and Hunt
also cites empirical evidence that questions the validity of our long-term bearish stance on US Treasury Bonds. The evidence is the performance of long-term government bond yields in Japan after the panic year of 1989 and in the US after the panic years of 1873 and 1929. The economic backdrops were quite different in each of these historical cases; and yet the following chart shows that in each case the yield on the long-term government bond behaved similarly, reaching its ultimate low of around 2% 12-16 years after the panic year and then remaining at a very low level for several more years. The implication is that if 2008 is akin to these previous panic years then the T-Bond yield won't bottom (the T-Bond price won't peak) until at least 2020.
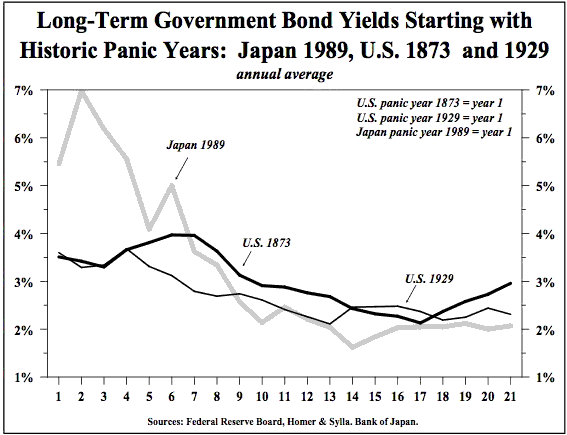
While it is clearly true that the T-Bond yield has trended downward since 2008 just as it did following the panic years of 1873 (US), 1929 (US) and 1989 (Japan), we disagree with the argument that the similar performance will continue. The main point of disagreement can be identified by referring to the first two sentences of the Hoisington report. Here are the relevant sentences:
"Long-term Treasury bond yields are an excellent barometer of economic activity. If business conditions are better than normal and improving, exerting upward pressure on inflation, long-term interest rates will be high and rising. In contrary situations, long yields are likely to be low and falling."
The Hoisington report goes on to make the points that the US economy is likely to remain weak, and that when debt levels are high, as they are today and have been for the past several years, government or central bank "stimulus" leads to even greater weakness.
We are certainly in agreement that the US economy will remain weak over the next few years and that the "stimulus" programs are bound to make things worse. However, we have a problem with the assertion that improving business conditions lead to upward pressure on "inflation" and higher long-term interest rates, and that worsening business conditions lead to the opposite. The fact is that economic growth puts DOWNWARD, not upward, pressure on "inflation" (all else remaining equal, the production of more 'stuff' will lead to a lower average price for 'stuff'). It is growth in the money supply that causes "price inflation" (reduced money purchasing power), with growth in the economy counteracting the upward pressure on prices stemming from money-supply growth.
There are many historical examples of economic weakness in parallel with high "price inflation". There are also examples of economic strength in parallel with "price deflation", such as the US during 1875-1895 (a period of fast real growth combined with downward-trending consumer prices).
We now turn to what we believe to be the critical similarity between the 20-year periods following the panic years mentioned above. The critical similarity wasn't the large amount of debt in the economy and it wasn't prolonged economic weakness. How could it be, when the 20-year period following the panic of 1873 encompassed the strongest real growth in US history and an overall debt level that was never particularly high. The key was "price deflation". For very different reasons (strong economic growth combined with modest monetary inflation in the US post-1873, economic weakness combined with monetary deflation and several other factors in the US post-1929, and slow monetary inflation combined with private-sector de-leveraging and rapid government debt accumulation in Japan post-1989), the purchasing power of the currency increased in each case.
The puzzle now facing us is that in response to the monetary inflation engineered by the Fed since the 2008 panic the US$ has been losing purchasing power at the rate of at least a few percent per year, but the T-Bond market has been acting as if the US dollar's purchasing power were stable or rising. To put it another way, considering the happenings on the "inflation" front it is puzzling that the T-Bond is now acting the way it did during the long periods of "price deflation" following the panics of 1873, 1929 and 1989 (Japan). One possible explanation is that the market has been anticipating a "deflation" that often seems to be lurking around the next corner but never actually materialises.
If the Fed remains committed to dollar depreciation then there is no question that dollar depreciation will continue. Our view is that the Fed will remain committed to this path and that at some point the market will discount this reality, causing the T-Bond yield to diverge in a big way from the pattern described in the Hoisington report. The Stock Market
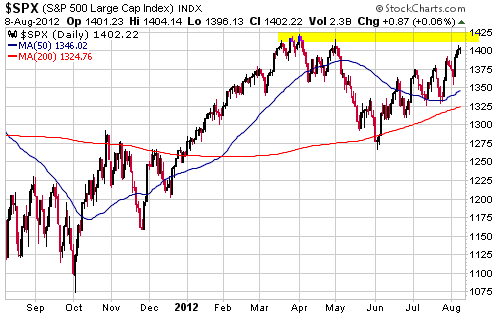
The following daily chart shows that the S&P500 Index (SPX) has just moved up to resistance defined by the highs made earlier this year. This is a time to be very wary. In 2007 the SPX topped in June and then made a marginal new high in October (4 months later) before embarking on an 18-month downward trend. In 2012 the SPX topped in April and could be about to make a marginal new high in August (4 months later).
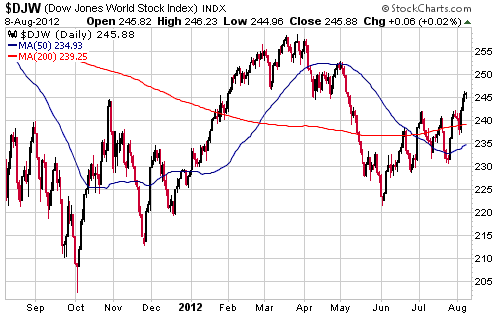
The Dow Jones World Stock Index (DJW) has just reached its highest level in more than two months, but unlike the S&P500 Index it is not yet close to the March-April high.
DJW's rebound from its June low has been choppy, which is typical of a counter-trend move. Some additional upward progress wouldn't be surprising, but in the absence of a massive new ECB or Fed inflation program the next big move is far more likely to be to the downside than the upside.
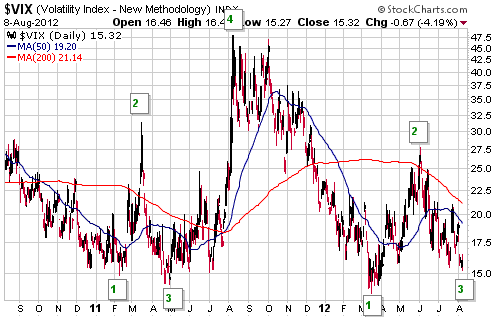
With reference to the following chart, the VIX's pattern continues to evolve as discussed in previous commentaries. The past two times this pattern occurred, point 3 was slightly lower than point 1. The VIX could therefore decline a bit further before reversing.
One way to speculate on, or hedge against, the possibility of a sizeable stock market decline occurring within the next three months would be to purchase the VIX Short Term Futures ETN (VXX). Another way would be to purchase VIX December call options. Be aware that both of these methods would probably result in large percentage losses in the event that the US stock market remained stable or firm over the period in question, but would result in much larger percentage gains in the event of a sharp 10%+ stock market decline.
Gold and the Dollar
Gold and Silver
Current Market Situation
Gold and silver are still grinding sideways within narrow horizontal ranges. Enough said.
Sprott Physical Silver Trust (PSLV)
Several times over the past 18 months we've discussed the absurdly high premium to net asset value (NAV) at which the Sprott Physical Silver Trust (PSLV) was trading. The premium was regularly above 20% and early this year was briefly above 30%. All premiums eventually disappear, regardless of the 'logical' arguments put forward by bullish investors for why the premiums will persist indefinitely.
At the close of trading on 8th August PSLV's premium to NAV
was only 2.93%, meaning that the premium has, for all intents and purposes, disappeared. As illustrated by the following chart, the current premium is near an all-time low.
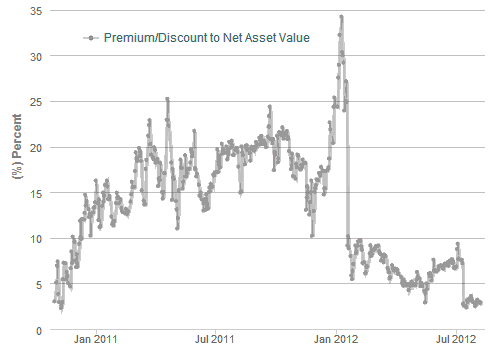
PSLV is a reasonable way to obtain exposure to physical silver at those times when it is trading at a low premium, but we are primarily interested in PSLV as a sentiment indicator. In particular, we view a low premium to NAV as sentiment-related evidence that the silver market is close to bottoming out.
Gold Stocks
Current Market Situation
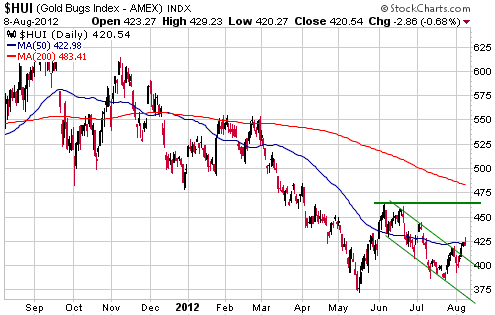
The HUI broke out of the downward-sloping channel that had confined it since early June, but aside from that the price action was uneventful over the first three days of this week. It will probably remain uneventful until gold breaks out of its trading range. Gold's breakout, when it finally comes, will most likely be to the upside.
We still think that the HUI stands a good chance of rising to 550 by October.
The surprisingly poor relative performance of the gold mining sector
In a speech delivered to the Melbourne Mining Club on 31st July,
Gold Fields CEO Nick Holland frankly discussed the reasons for the poor performance of the gold mining sector relative to the gold price over the past six years. According to Mr. Holland, an important contributor to the poor relative performance was the large increase in the total cost of mining an ounce of gold.
It came as no surprise to us that cost increases went a long way towards explaining why gold mining stocks hadn't done particularly well considering the rise in the gold price, but it was useful to have an industry insider quantify the cost increases. The following chart was taken from Holland's presentation and shows that during 2006-2011 the Notional Cost Expenditure (NCE) of the major gold producers had a compound annual growth rate (CAGR) of 16%, versus a gold price CAGR of 21%. NCE combines operating costs and capital expenditure.
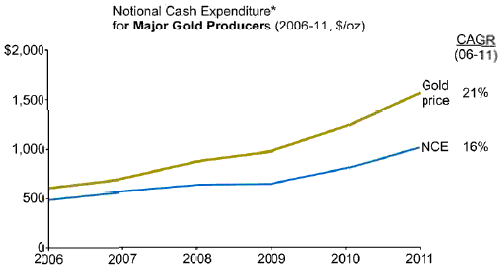
The upshot is that the large increase in the gold price since the beginning of 2006 has led to a relatively small increase in gold mining profitability due to an approximate doubling in the total cost of gold production. No wonder the major gold mining stocks, as a group, aren't much higher today than they were in early 2006.
Clearly, the managements of gold mining companies have to focus much more on keeping costs under control. It isn't easy, but it can be done.
Currency Market Update
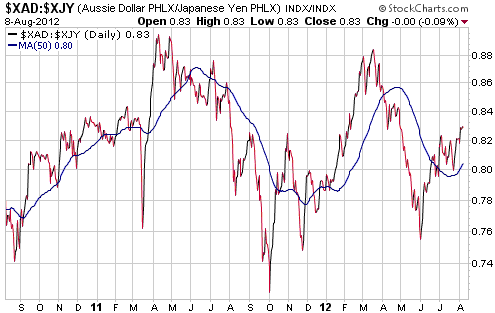
The A$/Yen cross rate is one of the best indicators of the famous risk-on/risk-off trading theme. When A$/Yen is trending upward the risk-on theme is dominant and when A$/Yen is trending downward the risk-off theme is dominant. Most recently, the financial markets were in risk-off mode from mid March through to early June and have since been in risk-on mode.
A$/Yen (see chart below) isn't yet extended to the upside, which suggests that the risk-on theme could run for a few more weeks. This is a realistic possibility, but we certainly wouldn't bet on it. Although the financial markets in general and stock markets in particular have recently become less worried about risk, the downside risk in growth-oriented investments such as industrial equities is now uncommonly high.
Update
on Stock Selections
Notes: 1) To review the complete list of current TSI stock selections, logon at
http://www.speculative-investor.com/new/market_logon.asp
and then click on "Stock Selections" in the menu. When at the Stock
Selections page, click on a stock's symbol to bring-up an archive of
our comments on the stock in question. 2) The Small Stock Watch List is
located at http://www.speculative-investor.com/new/smallstockwatch.html
 Endeavour Mining (TSX: EDV, ASX: EVR). Shares: 254M issued, 289M fully diluted. Recent price: C$1.99 Endeavour Mining (TSX: EDV, ASX: EVR). Shares: 254M issued, 289M fully diluted. Recent price: C$1.99
EDV is buying Avion Gold (AVR.TO) in an all-stock transaction: 0.365 EDV shares for each AVR share. Based on EDV's closing price on 7th August (the price when the deal was announced), the bid values AVR at C$0.88/share. This is a 56% premium to the 7th August closing price of AVR and amounts to about $390M for the entire company.
AVR is currently producing gold at the rate of about 100K ounces per year at its operations in Mali (West Africa), and the annual production rate is expected to increase to about 150K ounces over the months ahead due to a mill expansion. So, for its money EDV will be getting an extra 100K ounces/year of current production and an extra 50K ounces/year of baked-in future production growth. EDV will also be getting a 50% boost to its in-ground M&I gold resource.
At the agreed share exchange ratio the acquired assets are being valued similarly to EDV's existing assets. This leaves our assessment of EDV's upside potential unchanged. Specifically, the $3.93/share valuation and $4.50/share upside target explained in the 23rd July 2012 Weekly Update remain applicable. However, the risk is now much higher because at least one-third of EDV's expected future production of 450K ounces/year will come from Mali (a relatively high-risk country thanks to this year's political instability (military coup) and the on-going violent conflict in the north).
Due to the greater risk associated with EDV as a result of this deal we will be quicker to exit this stock in the future than would otherwise have been the case. To be a little more specific, rather than waiting for our upside price target to be reached we will possibly view a future rise to C$3.00-$3.50 as a good selling opportunity. As things currently stand, however, EDV is clearly a buy due to the stock market's extreme over-reaction to the takeover news.
Note that the AVR deal doesn't alter the risk/reward equation for the EDV C$2.50 warrants (TSX: EDV.WT.A). The downside risk associated with these out-of-the-money warrants was 100% prior to the AVR deal and is still 100%. The upside potential is still at least 300%.

EDV's management is clearly trying to grow the company rapidly via acquisitions in West Africa. We won't be surprised if its next takeover target -- after it beds down the AVR purchase -- is either Keegan Resources (KGN) or Volta Resources (VTR.TO), both of which have advanced exploration-stage projects in West Africa.
Chart Sources
Charts appearing in today's commentary
are courtesy of:
http://stockcharts.com/index.html

|

