![]()
![]()
![]()
![]()
- Interim Update 8th August 2018
Copyright
Reminder
The commentaries that appear at TSI
may not be distributed, in full or in part, without our written permission.
In particular, please note that the posting of extracts from TSI commentaries
at other web sites or providing links to TSI commentaries at other web
sites (for example, at discussion boards) without our written permission
is prohibited.
We reserve the right to immediately
terminate the subscription of any TSI subscriber who distributes the TSI
commentaries without our written permission.
The Stock Market
More Tesla (TSLA)
Tesla CEO Elon Musk may be going insane. On Tuesday he 'tweeted' that
he was considering taking TSLA private at $420/share and that the
financing for such a transaction was secured. This drove the share price
up 11% to about $380, a price area that coincides with the stock's
all-time high. This is a sign of insanity on Musk's part because a) if he
doesn't follow through and show that financing actually is in place then
he will have opened himself up to a class action lawsuit from
short-sellers and charges from the SEC, and b) there is almost no way that
such a transaction could be financed, even in the current easy-credit
environment.
Leveraged buyouts can only work if the company being bought has strong
positive cash-flow to cover the interest payments on the debt. TSLA is
therefore not candidate for such a buyout. However, perhaps Musk has found
some large investors who would buy the equity without saddling the company
with additional debt. It's hard to imagine that anyone with access to the
many billions of dollars required for such an endeavour (at $420/share
TSLA's market cap would be about $72B) would be dumb enough to buy this
floundering, cash-hemorrhaging company, although the Saudi royal family
can't be ruled out as a potential buyer.
In any case, from our
perspective TSLA remains in the 'too hard basket'. It is too risky to buy
and too risky to sell.
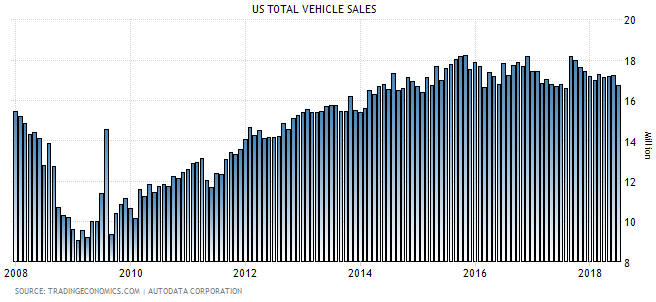
Peak Autos?
Tesla is
unique in many ways and is absurdly expensive relative to other
US-domiciled car manufacturers, but even the ones that look cheap based on
traditional valuation measures probably should be avoided. The reason is
that US motor vehicle sales may have reached a cyclical peak last year.
As illustrated by the following chart, monthly US vehicle sales have
been trending downward since last September and are no higher today than
they were during the first half of 2014. And with interest rates now in a
long-term upward trend the opportunity no longer exists for car makers to
attract legions of new customers with low-cost financing deals.
Current Market Situation
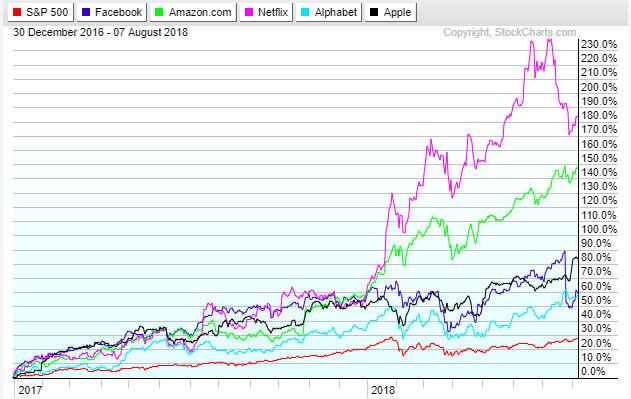
Over the past two
years the US stock market has been dominated by a small group of stocks
affectionately known as the FAANGs (Facebook, Amazon, Apple, Netflix and
Alphabet (Google)). The following chart compares the performances of these
five stocks with the S&P500 Index (SPX) since the beginning of 2017. The
SPX is the red line.
Notice that over the past month two of the
FAANG stocks (Netflix and Facebook) have plunged. This could be
significant, because when the leaders of a major upward trend start to
fall away it usually means that the market's upward trend is almost over.
The SPX has moved back to within 1% of its January high and its
channel top. It therefore can't rise much further without invalidating our
interpretation of the overall market situation.
By the way, the
bottom section of the following SPX chart shows the Common-Stocks-Only
NYSE Advance-Decline Line. This measure of the market's internal strength
barely skipped a beat during the January-February market correction and
made a new high as recently as Tuesday of this week. This is evidence that
the bull market is intact, but it doesn't preclude a tradable 1-3 month
decline.
The NASDAQ100 Index (NDX) has just risen for seven days in a row
without managing to exceed its July high. To validate our current view of
the world a downward reversal must happen very soon.
Gold and the Dollar
Gold
Another look at gold market sentiment
When analysing financial markets and the economy it is possible to
have too many indicators. The optimum number to have is the smallest
number that enables an accurate assessment of the situation being
analysed. Once you have enough indicators to reliably get an accurate
appraisal, adding more will muddy the waters. In simple terms, more
information is not always a good thing.
For example, when assessing
the probable timing of the next US recession we only care about three
indicators. These indicators, when taken together, have a near perfect
record over at least the past 60 years. There are countless other economic
indicators that can provide interesting and potentially-useful
information, but incorporating any of these other indicators into our
analysis will not be helpful if our sole objective is to figure out the
most likely timing of the next recession.
For another example, when
assessing gold market sentiment we take into account the results of two
surveys and certain aspects of the COT (Commitments of Traders) reports.
That's it. We are aware of many other gold-market sentiment indicators and
always remain open to the possibility that there are better tools out
there than the ones we are using, but we won't take an indicator seriously
unless it has proved itself over a long period under various market
conditions.
The above discussion leads us to the main point we want
to address. Due to it recently having reached an extreme, we have
revisited a gold-market sentiment indicator to which we normally don't pay
close attention. We are referring to an aspect of the COT data called the
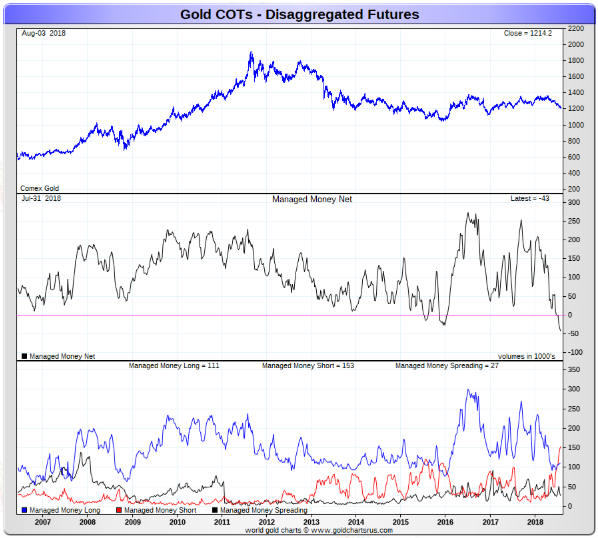
"Managed Money"* net position.
The black line in the middle section
of the following chart shows that the "Managed Money" net-long position in
gold futures, which tends to move up and down with the gold price, hit a
10-year low last week. This suggests that money managers, as a group, were
even more bearish on gold last week than they were at the December-2015
multi-year price bottom.
With sentiment being a contrary indicator, does this mean that the COT
situation is more bullish now than it was in December-2015?
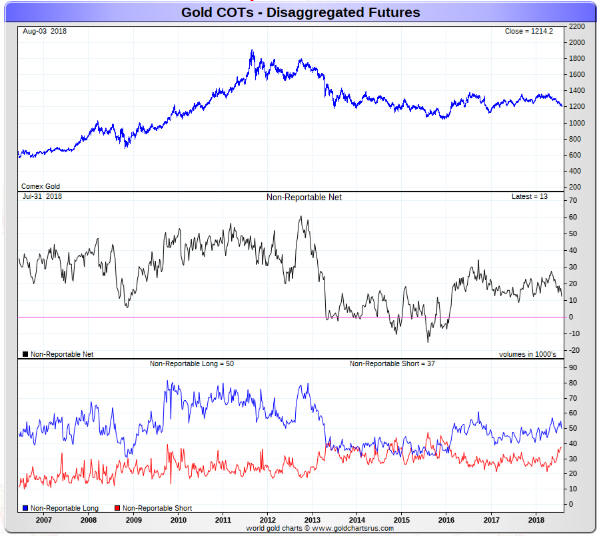
No,
because the middle section of the next chart shows that the
"NonReportable" traders (the proverbial dumb money) are nowhere near as
negative towards gold as they were at the December-2015 price bottom. Back
then they were net-short by about 8K contracts whereas last week they were
net-long by 13K contracts.
Also, it's worth mentioning that the "Managed Money" net-long position
in silver futures hit a 10-year low in early-April. This was a misleading
signal because, as noted in TSI commentaries at the time, the overall COT
situation for silver was no better than neutral back then (and, by the
way, is currently no better than neutral). That silver failed to do
anything interesting on the upside over the ensuing four months is
therefore consistent with the message from the COT data.
When it
comes to economics and other fundamentals we want our use of an indicator
to make sense based on both logic and historical performance, but when it
comes to measuring sentiment we only care about historical performance.
Based on what we've seen to date, the "Managed Money" net position adds no
value to what we get from other aspects of the COT data. In fact, it can
be misleading, possibly because managed money isn't inherently 'dumb
money'.
It so happens that the COT situation for gold became
decisively bullish last week for the first time this year. It is not as
bullish as it was in December-2015, but it is as bullish as it has been at
any point over the past 2 years. Furthermore, as at the end of last week
the Consensus-inc Bullish Sentiment Index for gold was only 24%, which is
a 14-year low.
*For
the purpose of the COT reports, a "money manager" is defined as a
"registered commodity trading advisor (CTA); a registered commodity pool
operator (CPO); or an unregistered fund identified by CFTC. These traders
are engaged in managing and conducting organized futures trading on behalf
of clients."
Current Market
Situation
It is fair to say that the sentiment backdrop is
now strongly supportive of the gold price. This means that there will be
plenty of fuel -- in the form of speculative short-covering and
long-accumulation -- to drive the price upward once the short-term price
trend reverses. This will be the case even if gold's true fundamentals
remain bearish, although there will not be anything more than a strong
short-term rebound in the gold price until the fundamental backdrop makes
a sustained move into bullish territory.
The immediate problem is
that there is no evidence of a reversal in the short-term price trend.
Since bottoming at US$1210 on 19th July the gold price has traded sideways
within a narrow range, leaving open the possibility that a plunge to a new
12-month low will precede the start of a tradable up-swing.
A daily
close above $1240 would signal a reversal. Also, a daily close above the
20-day MA (the black line on the following chart) would be an early
warning that an upward reversal was in the works.
Gold Stocks
From late-March to early-July
there was modest strength in the gold-mining indices/ETFs relative to gold
bullion. This was thought by many analysts to have bullish implications
for both the gold-mining sector and the bullion market, but strong rallies
in gold and the related investments usually aren't preceded by modest
relative strength in the mining stocks; they are usually preceded by
substantial relative WEAKNESS in the mining stocks. To put it another way,
it is capitulation, not stubborn optimism, by the holders of gold-mining
stocks that sets the stage for an intermediate-term rally.
Tradable rallies can start in the absence of capitulation, it's just that
the reward/risk will be much higher if the 'decks have been cleared'. We
haven't had a 'deck-clearing' plunge in the gold-mining sector yet and
there is no guarantee that we will get one, but prices are positioned in a
way that it could happen in the near future. Also, thanks to the price
action during the first half of this week it will now be easier for the
gold-mining sector to signal an upward reversal. We are referring to the
fact that during the first half of this week GDX broke below
intermediate-term support defined by numerous lows over the past 18 months
and the HUI dropped to long-term support defined by its December-2016 low.
Due to having breached obvious support at $21.00, to signal a reversal
all GDX would have to do now is close a day at $21.50 or higher. Doing so
would mark the preceding downside breakout as false. However, the downside
breakout suggests a short-term target of $18.50 and the breakout should be
respected until/unless it proves to be false.
It will be a little more difficult for the HUI to signal a reversal.
The quickest/simplest way for it to do so would be to spike at least a few
points below the obvious support at 160 and then close a day above 170.
The Currency Market
Currency market volatility
is very low at the moment, with the Dollar Index (DX) mired within the
confines of a gently-sloped rising wedge. The top of the 'wedge' is around
95.5, but there is important lateral resistance at 95 (95.07, to be
exact). The DX closed slightly above 95 on Monday and Tuesday and closed
slightly below 95 on Wednesday of this week.
A weekly close above
95.07 would be an upside breakout while a daily close below 94 would be a
downside breakout.
Our fundamentals-based model for the DX has an
interest-rate component and an equity component. The interest-rate
component is bullish for the DX if the US 10-year T-Note yield is in an
upward trend relative to the German 10-year Bund yield and the equity
component is bullish for the DX if US equities are in a strengthening
trend relative to European equities. The equity component seems to be the
more important over the long term, but there are periods when the
interest-rate component has the greater influence. We have been in such a
period over the past few months.
The following chart compares the
DX (the blue line) with the 10-year US-Germany yield spread. This chart
suggests that the direction in which the DX breaks out of its 'wedge' will
be determined by the direction in which the yield spread breaks out of its
recent narrow range.
Although we have been leaning towards the DX eventually breaking out
of its wedge pattern to the downside, the price action is about as neutral
as it can get. Note that an upside breakout by the DX potentially would
set in motion a sharp 3-6 week rally along similar lines to what happened
between late-April and late-May.
Updates on Stock Selections
Notes: 1) To review the complete list of current TSI stock selections, logon at
http://www.speculative-investor.com/new/market_logon.asp
and then click on "Stock Selections" in the menu. When at the Stock
Selections page, click on a stock's symbol to bring-up an archive of
our comments on the stock in question. 2) The Small Stock Watch List is
located at http://www.speculative-investor.com/new/smallstockwatch.html
Chart Sources
Charts appearing in today's commentary
are courtesy of:
https://stockcharts.com/
https://tradingeconomics.com/
http://www.goldchartsrus.com/
![]()