![]()
![]()
![]()
![]()
- Interim Update 8th November 2017
Copyright
Reminder
The commentaries that appear at TSI
may not be distributed, in full or in part, without our written permission.
In particular, please note that the posting of extracts from TSI commentaries
at other web sites or providing links to TSI commentaries at other web
sites (for example, at discussion boards) without our written permission
is prohibited.
We reserve the right to immediately
terminate the subscription of any TSI subscriber who distributes the TSI
commentaries without our written permission.
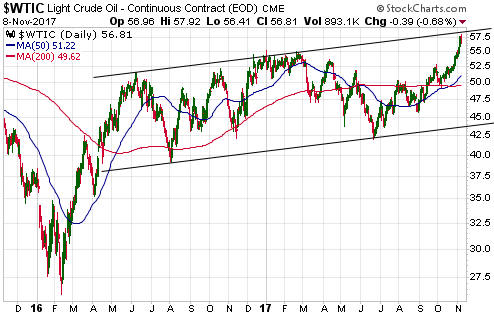
Oil and Gas
Oil extends its upside
breakout
It looks like Mohammed bin Salman (MBS), Saudi
Arabia's Crown Prince, is following the lead of Xi Jinping and using a
corruption crackdown as the cover for eliminating anyone perceived as a
threat to his absolute power. All senior government and military personnel
in China are corrupt, so to find evidence that can be used against any one
of them, all you have to do is investigate. It's no doubt a similar story
in Saudi Arabia.
News over the weekend that MBS had arranged to
have dozens of influential members of the Saudi royal family, government
and business community arrested as part of an anti-corruption campaign
created fear that the dominant member of OPEC was becoming politically
unstable. When this news was added to signs of increasing tension between
Saudi Arabia and Iran, the result was a 3% rise in the oil price on Monday
and an extension of the breakout move that occurred last Friday.
Monday's surge appears to have pushed oil to the top of an 18-month
channel. At least, that's one way to interpret oil's price chart (see
below). Therefore, the oil market is now 'overbought', 'overbullish' and
near intermediate-term channel resistance. At the same time, we explain
below that the fundamental backdrop is becoming increasingly supportive
for the oil price.
Oil fundamentals becoming increasingly bullish
As we've mentioned numerous times in the past, for an industrial
commodity with a large and liquid futures market the "term structure" in
the futures market (a.k.a. the futures curve) is the most reliable
indicator of the supply-demand situation.
An upward-sloping futures
curve (earlier-dated futures priced lower than later-dated futures) is
called "contango" and is the normal state of affairs. In this normal state
of affairs a more distant futures contract will have a higher price
because of the cost of storage and financing, not because traders expect
the price to be higher in the future.
When the curve flattens, in
most cases it means that the physical supply situation is getting tighter.
Why? Because if the gap between a futures price and the spot price falls
to the point where it is less than the cost of storage then a risk-free
arbitrage opportunity will be presented to the owners of physical supply
who won't need their supply prior to the time that the futures contract
expires. They can sell their physical oil, buy the futures and make a
guaranteed profit equal to the cost that they would have paid for storage
minus the difference between the futures price they paid and the spot
price they received.
Sometimes, the futures curve doesn't just
flatten, it inverts; that is, it becomes downward-sloping. This is called
backwardation. When the oil market is well into "backwardation" it means
that a substantial risk-free profit is being offered to the owners of
physical supply who are able to do the trade described above.
Since
risk-free profit opportunities tend to be rare and fleeting, the only way
that "backwardation" can be sustained is if very few owners of physical
supply are in a position to do the trade described above. In other words,
sustained "backwardation" implies a market with minimal surplus supply,
either because inventory levels are low or because the current owners of
the physical supply are unwilling to relinquish ownership even when
presented with a large financial incentive to do so.
Here are three
charts that show the shift in the oil market's futures curve over the past
few months. The first chart shows the situation at 20th June. This is a
picture of a normal, well-supplied market. The second chart shows the
situation at 16th August, by which time the curve had flattened markedly.
This implies that oil's supply situation tightened between 20th June and
16th August, but the fact that the curve still had an upward slope
suggests that there was no shortage in mid-August. The third chart shows
the current situation. This is a picture of a market in which you get paid
significantly more to deliver a barrel of oil today than to store the
barrel and deliver it a year from now, which implies a significant supply
shortage.
The last of the above charts indicates that the fundamental backdrop
is currently bullish for the price of West Texas Intermediate Crude
(WTIC). The futures curve for Brent Crude is even more bullish, so this is
a global phenomenon and not just a peculiarity of the US market.
The oil market's backwardation may soon disappear, but the fact that it
happened at all is bullish. It's the main reason that a bearish oil
speculation is of no interest to us at this time despite the market being
stretched in momentum and sentiment terms. However, the sentiment
situation keeps us cautious with regard to oil's short-term prospects.
Natural Gas (NG) is close to an upside breakout
The NG price is testing resistance at $3.20. A weekly close above this
resistance would be an upside breakout and would suggest that NG was on
its way to a 2-year high (above $3.90).
Petrus Resources (PRQ.TO), a junior Canadian NG producer, provides
TSI's solitary exposure to NG. PRQ's bottom line would be helped by a
sustained upside breakout in the NG price, although there isn't a strong
short-term correlation between the PRQ stock price and the NG price.
PRQ has support at C$2.05 and resistance at C$2.80. A close above
C$2.80 would suggest that the stock was on its way to at least C$3.50.
The T-Bond
rebound may be almost complete
The iShares 20+ Year Treasury
Fund (TLT) tested important support near $123 in late-October and has
since rebounded. We suspect that this rebound is forming the 'right
shoulder' of a 'head and shoulders' topping pattern. If so, the rebound
should end at or below $128.
Although the rebound is probably
almost complete in terms of price, we won't be surprised if it takes TLT a
few weeks to roll over into its next downward trend.
The Stock Market
In addition to the obvious
nominal price highs, the US stock market has broken many records over the
past few months. These records include:
1. The lowest ever reading
for the Volatility Index (VIX).
2. By far the greatest number of
single-digit VIX readings in any 6-month period.
3. By far the
highest median price/sales ratio in US stock market history.
4. The
highest daily RSI for the Dow Industrials Index since at least 1980.
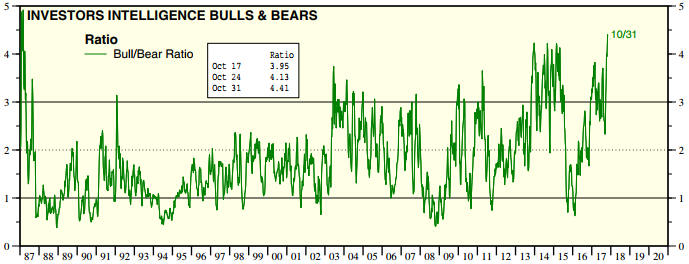
5. The highest Investors Intelligence bull/bear ratio since 1987.
The last of the above-mentioned records was achieved over the past
week and is illustrated by the following chart.
Cracks are appearing in some of the lesser indices, but the following
daily chart shows that the US stock market's most important index
continued its relentless low-volatility upward march over the first three
days of this week. All heck is going to break loose at some point,
probably for no obvious reason. Right now, however, there isn't a care in
the world.
Gold and the Dollar
Gold
In
the latest Weekly Update, we wrote:
"The fundamental backdrop
was still bearish for gold at the end of last week, although less so than
it was a couple of weeks earlier. We won't be surprised if the fundamental
backdrop switches from bearish to bullish within the next two weeks, but,
as usual, a lot will depend on what happens to the bond market."
Over the first three days of this week the fundamental backdrop
shifted in gold's favour by enough to push the GTFM into bullish
territory, although the GTFM can't officially change until the end of the
week. In other words, the weekly closing levels must confirm the shift in
order for it to register in our model.
The shift in the fundamental
backdrop reduces the risk that the gold price will plunge to the
low-$1200s prior to a short-term bottom, but, as also written in the
latest Weekly Update:
"Gold's biggest near-term threat is
sentiment, not fundamentals. Despite the roughly $100 decline in the gold
price over the past two months, speculators, as a group, remain stubbornly
optimistic."
It is certainly possible that gold will make a
short-term price bottom without a preceding purge of leveraged
speculators, but a rally that began in the absence of a solid sentiment
foundation probably would be limited in size to about $100 and limited in
time to about two months.
Important nearby support still lies at
$1260. There still could be a spike below this support prior to a
short-term bottom, but, as noted above, the risk of a plunge to the
low-$1200s has diminished over the past few days.
Gold Stocks
In the latest Weekly Update we
wrote that a) the HUI had made a 1-2 month high or low at 2-month
intervals beginning in early-March, b) the next turning point in this
2-month cycle was due immediately, and c) if the cycle was still in force
it would have to be a turn from down to up.
Based on the price
action over the first three days of this week it looks like the 2-month
cycle low was put in place last Friday (3rd November). The less-likely
alternative, assuming that the cycle remains in force, is that there will
be a sharp decline to a cycle low over the final two trading days of this
week.
If the 2-month cycle remains in effect, which currently seems
likely, then the rally that follows the early-November low should continue
until at least early-December and could continue until early-January. In
other words, as things stand today the most likely scenario is that a 1-2
month rally has just begun.
Turning to the charts, today we are
going to focus on GDX. The reason is that whereas the HUI, the XAU and
GDXJ have not yet rebounded far enough from their recent lows to challenge
any resistance levels of significance, GDX has already reached its 200-day
MA. In other words, GDX's rebound is already undergoing its first
meaningful test.
The stage is set for a daily close by GDX above
its 200-day MA to be the first evidence of an upward trend reversal.
The Currency Market
The Dollar Index (DX) has
drifted sideways for the past 8 trading sessions. This price action has
the look of a mid-trend consolidation, which means that the next
significant move is more likely to be to the upside than to the downside.
Updates on Stock Selections
Notes: 1) To review the complete list of current TSI stock selections, logon at
http://www.speculative-investor.com/new/market_logon.asp
and then click on "Stock Selections" in the menu. When at the Stock
Selections page, click on a stock's symbol to bring-up an archive of
our comments on the stock in question. 2) The Small Stock Watch List is
located at http://www.speculative-investor.com/new/smallstockwatch.html
Chart Sources
Charts appearing in today's commentary
are courtesy of:
http://stockcharts.com/index.html
http://www.yardeni.com/
![]()