![]()
![]()
![]()
![]()
- Interim Update 9th January 2019
Copyright
Reminder
The commentaries that appear at TSI
may not be distributed, in full or in part, without our written permission.
In particular, please note that the posting of extracts from TSI commentaries
at other web sites or providing links to TSI commentaries at other web
sites (for example, at discussion boards) without our written permission
is prohibited.
We reserve the right to immediately
terminate the subscription of any TSI subscriber who distributes the TSI
commentaries without our written permission.
Random Predictions For
2019
1) Early last year we predicted
that the US stock market would experience greater-than-average volatility
over the year ahead. This obviously happened, as there were more 2%+
single-day moves in the SPX during 2018 than in an average year.
We
expect the same for this year, that is, we expect price volatility to
remain elevated. The reason is that the two most likely scenarios involve
abnormally-high price volatility. One of these scenarios is that a
cyclical bear market began last October, and bear markets are
characterised by periods of substantial weakness followed by rapid
rebounds. The other scenario is that a very long-in-the-tooth cyclical
bull market is about to embark on its final fling to the upside.
2)
When attempting to predict when a period of economic growth will end it is
futile to look more than 6-12 months into the future, because there are no
leading recession indicators that can predict that far ahead with
acceptable reliability. There are, however, leading indicators that can be
used to determine the probability of a recession beginning within the next
few quarters.
Early last year these indicators told us that a US
recession would not begin during the first half of the year. They
currently tell us that the US economy stands a good chance of commencing a
recession this year, most likely during the second half of the year. Note,
though, that if a recession does get underway this year it won't become
official until 2020, because recessions usually aren't confirmed by the
National Bureau of Economic Research until about 12 months after they
start.
3) Regarding 'cryptoassets', at around this time last year
we wrote:
"...it's a good bet that the Bitcoin bubble reached
its maximum level of inflation late last year. Also, the broader bubble in
cryptoassets is set to burst during the first quarter of this year."
And:
"By the end of 2018 it will be apparent that the
public's enthusiasm for Bitcoin and the "alt-coins" was one of history's
great speculative manias."
This assessment looks correct.
We don't have a strong opinion about what will happen to
'cryptoassets' in 2019. This is partly because there is no reasonable way
to determine the fair value of these assets. For Bitcoin, for example, a
price of $3,000 is no more or less sensible than a price of $30,000 or a
price of $300.
Distributed ledgers can be very useful, but there
should be ways to implement them without consuming a lot of resources. If
so, the price of Bitcoin eventually will drop to almost zero.
A
year ago we also predicted:
"Despite spectacular collapses in
the prices of the popular 'cryptoassets' during 2018, central banks
including the Fed and the ECB will firm-up plans to introduce their own
blockchain-based currencies. This will be driven by a desire to eliminate
physical cash, the thinking being that if there is no physical money it
will be more difficult for the average person to make/receive unreported
payments and escape a negative interest rate."
As far as we
know the major central banks didn't firm-up plans to introduce their own
blockchain-based currencies last year, but we continue to expect that they
will -- for the reasons mentioned above.
4) Regarding the Fed's
expected actions in 2018, early last year we wrote:
"Due to
rising commodity prices it's a good bet that "price inflation" will become
a higher-profile issue during the first half of 2018, prompting the Fed to
move ahead with its quantitative tightening (QT) and make two more rate
hikes. However, both the QT and the rate-hiking will be put on hold during
the second half of the year in reaction to increasing downside volatility
in the stock market."
We got the anticipated rate hikes during
the first half and the increasing downside stock-market volatility during
the second half of last year, but the Fed stuck to its guns. However, over
the past three weeks the Fed Chairman has made it clear that the Fed will
be quick to change direction if the stock market continues to decline
and/or the economic numbers point to significant weakness.
For 2019
we expect one Fed rate hike, most likely in June. Also, we expect that
people 'in the know' will explain to senior Fed members that it's the
balance-sheet reduction program (QT) that really counts, prompting the Fed
to slow the pace of QT during the first half and conclude the QT program
before year-end.
5) The ECB has just ended its QE program and has a
tentative plan to implement its first rate hike during the third quarter
of 2019. Given that nothing has been learned from the failed monetary
experiments of the past few years, it's a good bet that evidence of
declining economic activity in the future will be met by the ramping-up or
reintroduction of policies that failed in the past. Therefore, we predict
that the ECB will not increase its targeted interest rates this year and
will restart QE during the second half of the year.
6) This is not
a prediction for 2019, but rather an observation that could apply for
decades to come. We suspect that the age of real estate has ended.
We don't mean that from now on it will be impossible to achieve good
returns by investing in real estate, but that gone are the days when
anyone could buy a house almost anywhere and likely end up with a sizable
profit as long as they held for 10 years or more. From now on only astute
investors will consistently make good returns from real estate, where
"astute" means able to time the cyclical swings in the broad market or
able to correctly anticipate future supply-demand imbalances in specific
areas.
For the average person, residential property will transition
from an investment to what it was prior to the 1970s: a consumer good
(something bought solely for its use value).
The reason for the
change is the interest-rate trend. The 3-4 decade downward trend in
interest rates resulted in a 3-4 decade upward trend in housing
affordability for buyers using debt-based leverage (that is, for the vast
majority of buyers). There were corrections along the way, but provided
that long-term interest rates continued to make lower lows there would
eventually be a pool of new debt-financed buyers able to pay a much higher
price.
There's a good chance that the secular interest-rate trend
reversed from down to up during 2016-2018. If so, future house buyers that
don't have good timing and/or substantial area-specific knowledge
generally won't make long-term capital gains on their residential property
purchases.
A multi-week top
for the oil price?
In the latest Weekly Update we
wrote that 1) oil's initial rally from its December low probably will be
limited by resistance in the low-$50s and followed by a decline to test
the low, and 2) a larger and longer rally should get underway after the
December low is tested.
The following chart shows that there was a
positive momentum divergence at the December low and that the initial
rally from the low has reached resistance in the low-$50s. Also, note that
there is substantial resistance at $53-$55 that should limit the initial
rally if some additional headway is made over the days ahead.
There's a good chance that the next $5+ move in the oil price will be to
the downside, but there's also a good chance that oil will trade in the
$60s before the middle of this year.

The Stock Market
The US stock market's
valuation
According to the four long-term valuation
measures shown on the following chart, at its 2018 high the S&P500 Index
was more expensive than at any time over the past 118 years with the
exception of 1999-2000 (the peak of the dot.com bubble). It was more
expensive than at the 1929 bubble peak and a lot more expensive than at
the major peaks of 1937, 1966 and 2007.
These long-term valuation
measures don't matter until a bear market gets underway, at which point
they indicate the magnitude of the downside risk over the ensuing 1-3
years. The current message is that IF (still a big if) a bear market began
last year then within the next two years the SPX will trade at least 50%
below last year's high, that is, at 1500 or lower. The reason is two-fold.
First, bear markets usually don't end until after the market becomes
under-valued. Second, the SPX would have to fall to around 1500 just to
get the long-term valuation measures down to their historical averages.
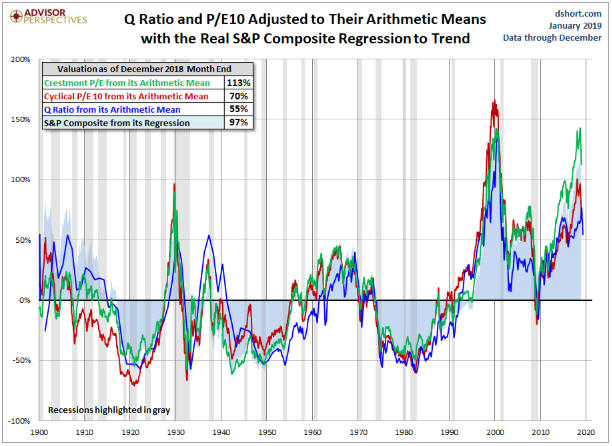
Chart source:
dshort
An argument can be made that the SPX was close to fair
value at last month's low, but only by assuming that earnings will grow at
a healthy pace over the next few years and that interest rates will remain
near their current depressed levels. These assumptions probably aren't
valid. This is partly because there's a high probability that the US
economy will enter a recession within the next 12 months, and if this
happens then 2020 corporate earnings will be much lower than 2018 or 2017
earnings. It's also because interest rates are probably now in long-term
upward trends.
Current Market Situation
In
the latest Weekly Update, we wrote: "The maximum levels that could be
reached prior to multi-week tops are 2600 for the SPX and 6600 for the
NDX. These levels are determined by the October lows."
We
should have written "should', not "could", because obviously it is
possible for the indices to trade higher. In any case, the following daily
charts show that the aforementioned maximums were reached on Wednesday 9th
January.
We have been expecting that the initial rally from the December low
would be followed by a decline to test the low and then a larger/longer
rally, regardless of whether we are dealing with a new bear market or an
intermediate-term bull-market correction. The attainment this week of
maximum target levels for the initial rally therefore should have set the
stage for tradable multi-week declines in the senior stock indices.
Although this remains the most likely outcome, something happened over the
past three days that muddied the waters. What happened was a surge in the
McClellan Oscillator (MO) for both the NYSE and the NASDAQ.
To
further explain, in the latest Weekly Update we wrote:
"The
NASDAQ's MO has risen to roughly the level that coincided with rebound
peaks in March and October of last year. This means that the market is
stretched to the upside on a short-term basis. However, if the MO were to
move significantly further into 'overbought' territory, say to 75 or
above, it would be a sign of strength rather than a warning of high
downside risk. This implies that the top of the initial rally should be
close IF -- as is reasonable to assume -- we are going to get a test of
the December lows prior to a more substantial rally."
Over the past
three trading days the MOs for both the NYSE and the NASDAQ moved
significantly further into 'overbought' territory -- to at or near 20-year
highs. A chart showing the NYSE Composite Index and the NYSE MO is
presented below. The signal is not infallible, but an MO surge of this
magnitude suggests the sort of internal strength that usually is followed
by only minor setbacks over the ensuing few weeks.
The odds still favour a test of the December low within the next two
months, but there is also a realistic chance that the next short-term
correction will do no more than retrace half of the initial rally from the
low.
New Option Positions
From the latest
Weekly Update:
"For TSI record purposes, a position will be
taken in the SPY (S&P500 ETF) 15th February-2019 $245 put option if it
trades at $3.60 this week. The option ended last week at around $4.00. For
the option to trade at our stipulated buy price the SPX would have to rise
to around 2550. Also, a position will be taken in the SPY 15th March-2019
$245 put option if it trades at $4.30 this week. The option ended last
week at around $6.00 and will only drop to our stipulated buy price this
week if the SPX rises to around 2600. We don't expect the SPX to get that
high before the start of the next meaningful decline, but a near-term rise
of that magnitude is not out of the question."
The
above-mentioned February put was added on Monday 7th January at $3.60 and
the above-mentioned March put was added on Wednesday 9th January at $4.16
(anyone with an outstanding order to buy at $4.30 would have been filled
at the open on Wednesday at $4.16).
Due to the MO surge discussed
above, we will be quick to exit the February put.
Gold and the Dollar
Gold
It's possible that last Friday's outside-down day marked a multi-week top
for the US$ gold price, but that hasn't been confirmed. A daily close
below the 20-day MA (the black line on the following chart) would be
preliminary evidence that such a top is in place. The 20-day MA is at
$1270 and is rising at the rate of $5-$10 per week.
A test of major
resistance in the $1360s is a realistic possibility for later this
quarter.
Gold Stocks
The Gold Miners ETF (GDX) is
slightly below the top of its rising short-term channel, which is where it
has been for about two weeks now. The channel top is at approximately
$21.70. Also, GDX is oscillating around lateral support/resistance at
$21.00, and the 200-day MA (near $20.60 at this time) has acted as support
during recent pullbacks.
In our most recent two commentaries we wrote that a pullback to
support and upward acceleration were equally-probable near-term outcomes.
That's still the case. Probably all it would take to get some upward
acceleration in the gold-mining sector is a couple of daily closes above
US$1300 in the bullion price.
As mentioned above, the 200-day MA
has been acting as support during pullbacks. Therefore, a daily close
below this MA (say, $20.50) would be evidence that a multi-week top is in
place.
Thanks to the choppy price action of the past three weeks,
the gold-mining sector (as represented by GDX) is not short-term
'overbought'. Be aware, though, that if it does become so via a sharp
up-move within the next several days then it will be vulnerable to
substantial weakness in the broad stock market. To put it another way, if
the gold-mining sector is 'overbought' near the start of the next sizable
decline in the broad stock market then gold stocks probably will go down
with most other stocks.
The Currency Market
The Dollar Index (DX) has finally broken below support at 95.75. This
validates our short-term target of 93.50. The associated target for the
euro is 1.18.
The fundamentals will determine whether the DX is
immersed in a short-term correction prior to a rise to new 12-month highs
or the first leg of an intermediate-term downward trend. Our
fundamentals-based model shifted from US$-bullish to neutral last week,
but from here it could quickly flip back to bullish or work its way into
bearish territory. If it does the latter then support at 93.5 will not act
as a floor for long.
Note that the DX must end this week below
95.75 to confirm the breakout. Also note that a daily close above 96 at
any time will suggest that the short-term downward trend is over.

Updates on Stock Selections
Notes: 1) To review the complete list of current TSI stock selections, logon at
http://www.speculative-investor.com/new/market_logon.asp
and then click on "Stock Selections" in the menu. When at the Stock
Selections page, click on a stock's symbol to bring-up an archive of
our comments on the stock in question. 2) The Small Stock Watch List is
located at http://www.speculative-investor.com/new/smallstockwatch.html
Chart Sources
Charts appearing in today's commentary
are courtesy of:
https://stockcharts.com/
![]()