|
- Interim Update 9th May 2012
Copyright
Reminder
The commentaries that appear at TSI
may not be distributed, in full or in part, without our written permission.
In particular, please note that the posting of extracts from TSI commentaries
at other web sites or providing links to TSI commentaries at other web
sites (for example, at discussion boards) without our written permission
is prohibited.
We reserve the right to immediately
terminate the subscription of any TSI subscriber who distributes the TSI
commentaries without our written permission.
Inflation Update
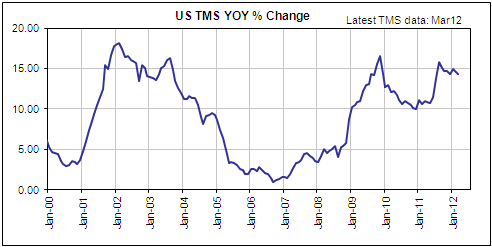
The US is experiencing its longest ever period of double-digit money-supply growth. The record prior to this year was 37 consecutive months during which the year-over-year (YOY) rate of True Money Supply (TMS) growth was 10% or more. This record was put in place by the Greenspan-led Fed during 2001-2004, but is in the process of being 'blown away' by the Bernanke-led Fed. When the April money-supply statistics are reported next week they will show that the US has just achieved its 40th consecutive month of double-digit monetary inflation. Comfortable that any "inflationary" effects of this monetary expansion will prove to be transitory and convinced that creating money out of nothing can help the economy, Bernanke seems determined to set a record that will be very hard to break.
The US money-supply situation is illustrated below. The YOY rate of TMS growth has tapered off over the past seven months, but at around 14.5% it remains near the top of its 12-year range.
A comparison of the above chart with the one displayed below makes it clear that the current euro-zone money-supply situation is very different from that of the US. Although the euro TMS growth rate has recently begun to edge upward, it remains very low by fiat money standards. In particular, we note that the YOY rate of increase in euro supply has now been below 3.5% for 15 consecutive months.
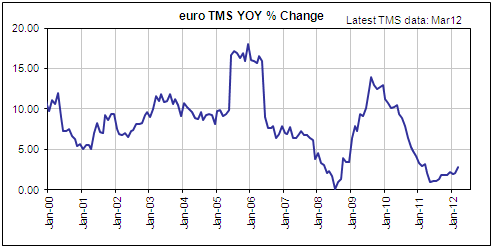
The on-going slow rate of growth in euro supply is at odds with the Long-Term Refinancing Operations (LTROs) conducted by the ECB during December-2011 and February-2012. These operations resulted in the creation of more than one trillion new euros, and yet the euro supply only increased by about 50 billion from the end of November-2011 through to the end of March-2012.
A large increase in the amount of money that the private banking industry has on overnight deposit with the ECB partly explains why the LTROs haven't YET had a big effect on euro TMS (like US$ reserves held at the Fed, euros held at the ECB aren't included in TMS). We emphasised the word "yet" in the preceding sentence because this money will eventually be 'put to work' by the private banks, meaning that it will eventually be used to support additional lending or asset purchases by the banks. Otherwise, the private banks would effectively be engaging in a negative carry trade in which money is borrowed from the ECB at 1% (the LTRO interest rate) and then loaned back to the ECB at 0.25% (the amount of interest paid by the ECB on overnight deposits). This would result in a guaranteed loss of 0.75%.
Private sector de-leveraging in Europe is probably also a significant factor, in that the ECB's additions to the money supply have probably been offset by loan repayments (a net repayment of bank loans will cause the money supply to shrink).
The combination of US TMS and euro-zone TMS (converted to US dollars) is what we call G2 TMS. A chart of the YOY growth rate of G2 TMS is displayed below. For practical speculation, this is probably the most important of our three money-supply charts.
The rate of growth in G2 TMS is currently nowhere near as high as it was when both the Fed and the ECB were inflating like mad in 2009, but it is a lot higher than it was prior to the market collapses or 2001-2002 and 2007-2008.
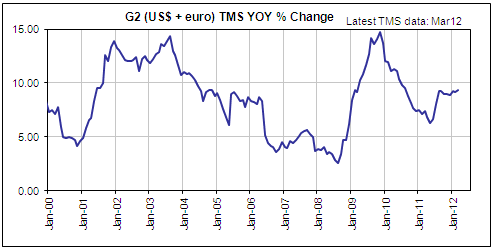
What happens to the G2 TMS growth rate over the next few months will probably be determined to a greater extent by the actions of the ECB than the actions of the Fed. The reason is that under the flawed Keynesian doctrine that dominates the world of central banking, the ECB presently has a much better excuse than the Fed to promote inflation. The Stock Market
During the first half of this week the Dow Jones World Stock Index (DJW) broke decisively below intermediate-term support at 245.
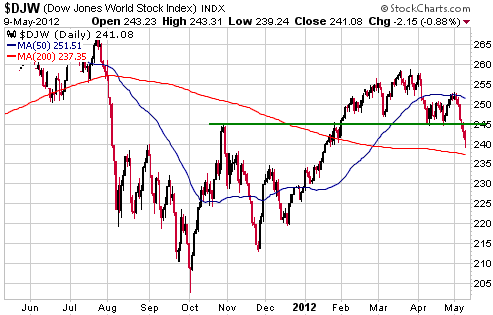
The S&P500 Index briefly traded below short-term support, but has remained well above intermediate-term support. For the S&P500 to do what the DJW has just done, it would have to close below 1290.
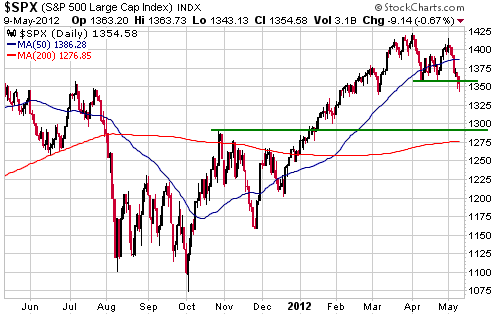
The above charts tell us that large-cap US equities have been stronger than equities in general. That's all. We could draw a lot more lines on the charts and use these lines to concoct a more interesting story, but we'll leave that to other newsletter writers.
Our 'gut feel' is that the senior stock indices are now close to short-term bottoms.
Gold and the Dollar
Gold
The US$ gold price broke below support in the $1620s early this week and then quickly lost an additional $50. The RSI shown on the following daily chart is now as low as it was when the price was bottoming in December. Market Vane's bullish consensus for gold is also now as low as it was when the price was bottoming in December.
It's a similar story in the silver market.
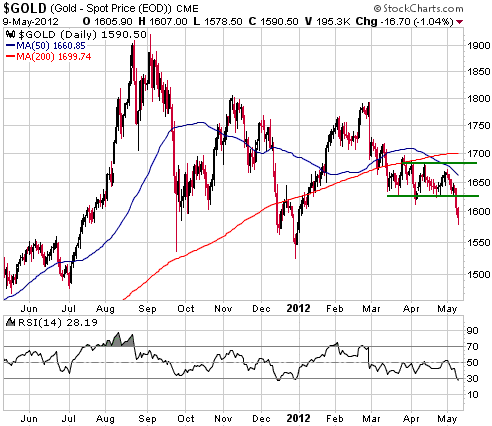
As the market for gold shares has clearly demonstrated over the past two months, markets sometimes continue to trend downward after sentiment and technical indicators reach levels that typically mark price lows. Gold was PROBABLY at or close to a short-term bottom when it traded in the $1570s on Wednesday, but this is not a probability that anyone should bet the final forty acres on.
On the 'fundamentals' front, gold's situation just became more bullish even as its price was falling. The more bullish fundamental backdrop for gold resulted from the rejection of "austerity" by voters in France.
The newly elected president of France has been labeled a socialist, but it is more apt to describe him as an enemy of the free market and a believer that government's legitimate role involves the redistribution of wealth. This description also fits his predecessor and almost all current heads of state, including the political leaders of the US, the UK, Germany, Russia, Japan and China. The difference between these political leaders tends be one of degree rather than overarching philosophy. Metaphorically speaking, they are all running in the same (wrong) direction, it's just that some run faster than others. It seems that France has just swapped one leader who was running in the wrong direction for another who has promised to run in the wrong direction a little faster.
The recent attempts by euro-zone governments to practice "austerity" have given austerity a bad name, because they have generally involved asking the average person to endure greater hardship so that banks and bondholders could be better off. However, there's no good reason to believe that genuine austerity (the type needed to set the stage for real economic progress) would fare any better at this time. The sad truth is that far too many people believe that they have the right to feed at the government trough. That's why the current leaders are the current leaders, and why Francois Hollande's victory in France's presidential election is less likely to be an isolated event than part of a trend.
The point we are working our way around to is that the political winds appear to be changing in a way that will lead to more government spending, more inflation and less productivity, at least in Europe. This is bearish for most investments and bullish for gold.
Gold Stocks
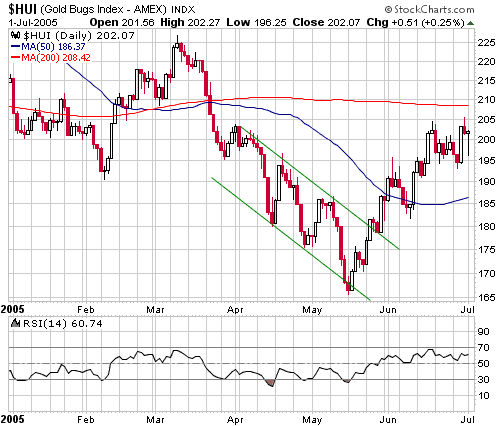
In the latest Weekly Update we discussed the similarities between the HUI's recent price action and the price action that led to intermediate-term upward reversals during May of 2004 and 2005. We pointed out that this year's decline looked most similar to the decline leading up to the May-2005 bottom.
This week's price action enhances the similarities with May of 2005, for the following reasons:
1) In May of 2005 there was a final 5-day plunge to just below the bottom of the short-term price channel to set the low. This is illustrated by the first of the daily charts displayed below. The second of the charts displayed below shows that the current market has just done something similar.
2) During the March-May decline of 2005 there were 4 separate occasions when the HUI's RSI moved down to 30 or lower. If we take some poetic license and count the late-April RSI decline to just above 30, the current decline has now matched this achievement. This is also illustrated by the charts displayed below.
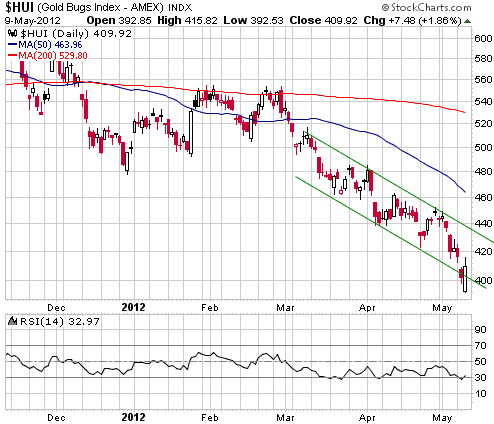
So, is a bottom now in place?
It could be, but obviously we don't know if it is or isn't. Intermediate-term turning points can only be identified with certainty well after the fact. In the Weekly Update we said that it would take a daily close above 452 to confirm that a bottom was in place, but as a result of this week's action we think that a daily close above 440 would suffice.
At this stage it is actually important NOT to have a strong opinion as to whether a bottom is in place. A bottom could be in place, but what if it isn't? How are you going to react if the HUI breaks to new lows over the days ahead? If you are convinced that a bottom is in place and then the market drops to new lows, you will probably panic and sell at absolutely the wrong time.
With regard to our own money management, we have been steadily buying gold stocks while trying to maintain a substantial cash reserve. This has involved picking away at stocks for which our conviction is highest and raising cash where there is reasonable liquidity and where our conviction is not as high. For example, during the first three days of this week we added to our positions in five stocks and exited our positions in four stocks. Of the stocks we sold, none are current members of the TSI List and only one is in the gold sector. Of the stocks we bought, four (EVN.AX, KGN, PVG and VTR.TO) are current members of the TSI List and all are in the gold sector.
Currency Market Update
The recent stock market weakness and Europe's acceleration in the wrong direction have boosted the US dollar, but on a bigger-picture basis the Dollar Index's recent price action has been more of the same. As illustrated by the following daily chart, since late January the Dollar Index has been oscillating around its 50-day moving average.
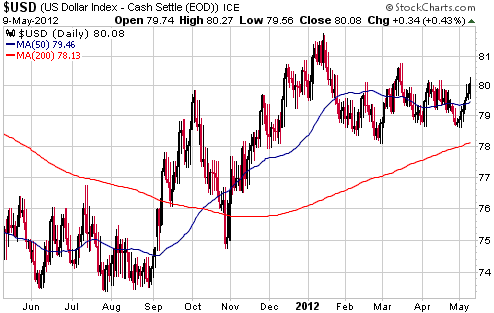
Considering everything that's happening it could be considered strange that the US$ hasn't been stronger. Our view is that the US$ is being held back by the fact that so many speculators are already positioned for a euro decline. With so many speculators expecting the euro to tank and already positioned accordingly, a large euro decline will require a truly momentous turn of events.
Update
on Stock Selections
Notes: 1) To review the complete list of current TSI stock selections, logon at
http://www.speculative-investor.com/new/market_logon.asp
and then click on "Stock Selections" in the menu. When at the Stock
Selections page, click on a stock's symbol to bring-up an archive of
our comments on the stock in question. 2) The Small Stock Watch List is
located at http://www.speculative-investor.com/new/smallstockwatch.html
 Australian Gold Stocks Australian Gold Stocks
During the March-April price slide in gold equities, Australian gold stocks held up quite well. However, over the past several trading days they have succumbed to the downward pressure. This is creating buying opportunities for our readers who have access to the Australian stock market.
At this time we are most interested in companies that have their gold mining assets in Australia, as opposed to companies that are listed in Australia but do most of their mining elsewhere. Dragon Mining (ASX: DRA), which operates in Scandinavian countries, is an exception and is a very good candidate for new buying near its current price of A$0.84.
Australia-based gold miners have two important things in their favour right now, the first of which is low political/geographical risk. There is a risk that higher taxes will be imposed on gold miners at some point, but the Australian government is unlikely to do anything extremely damaging to the industry. Australia's geographical isolation is also a plus in a world that is becoming increasingly unstable. The second favourable factor of importance is that if commodity prices get a lot weaker, then so will the Australian dollar. This provides some protection to the profit margins of Australia-based mining operations.
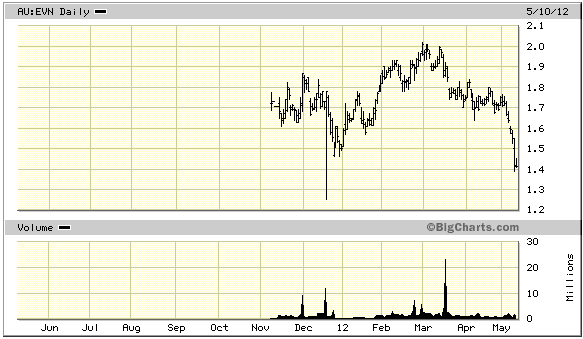
Evolution Mining (ASX: EVN) is the only current member of the TSI List that produces most of its gold in Australia. It is a profitable 350K-oz/year gold miner with a strong balance sheet and substantial in-house growth potential. Last week it traded in the A$1.70s, but this week it has plunged to the low-A$1.40s where it is a strong buy.
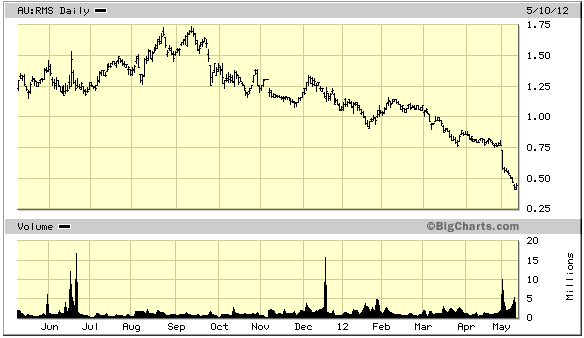
Ramelius Resources (ASX: RMS) is an Australia-based junior gold producer with a strong balance sheet that is slated to produce about 100K ounces of gold over the next 12 months. RMS is not a member of the TSI List at this time, but is a potential future addition. Here's a brief introduction to the company:
RMS is currently producing gold from its Wattle Dam project, an underground mining operation. This project should produce about 40K ounces over the next 12 months, at which time it will be fully depleted unless more reserves are discovered. If the Wattle Dam mine is depleted as expected, another of RMS's projects should be able to make good use of Wattle Dam's processing plant.
The bulk of RMS's current value is associated with the Mt Magnet open pit mine, which has just commenced production and is expected to ramp up to 80K-oz/yr over the next few months. Mt Magnet has a total resource of 3M ounces (1.8M M&I plus 1.2M Inferred).
The period immediately after a new mine goes into production is risky, because there are almost always teething problems and sometimes these teething problems can lead to much lower production and/or much higher costs than anticipated. This risk is now faced by RMS, although it is mitigated by the fact that the company has no debt, $55M of cash, and additional cash coming in from Wattle Dam. In other words, the company appears to have the financial wherewithal to handle teething problems at Mt Magnet.
RMS has a few other interesting, albeit small, projects, including the Vivien project recently purchased from Gold Fields (GFI).
With a share count of 336M and net cash of $55M, RMS's enterprise value is around $100M at the current share price of A$0.47. This is roughly the same as the replacement value of its Mt Magnet processing plant.
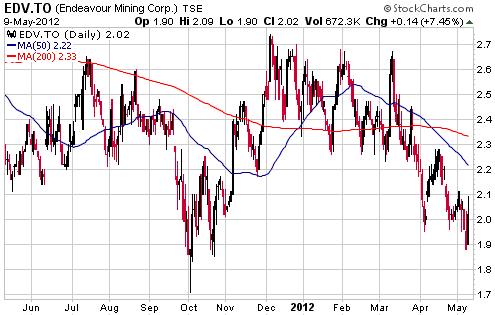
Endeavour Mining (TSX: EDV, ASX: EDR). Shares: 254M issued, 289M fully diluted. Recent price: C$2.02
EDV has been comparatively resilient over the past few weeks, meaning that it has been hammered more gently than most other junior gold mining stocks. This is probably because it is generating lots of cash.
As per the results announced this week, EDV had per-share cash flow and earnings of $0.14 and $0.07 during the first quarter of this year. When these figures are annualised they imply that EDV is presently trading at 3.6-times cash flow and 7-times earnings.
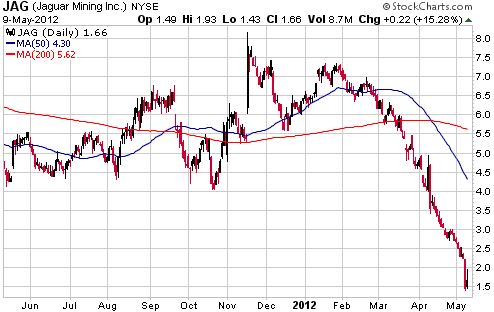
Jaguar Mining (NYSE and TSX: JAG). Shares: 84M issued, 88M fully diluted. Recent price: US$1.66
JAG's stock price plunged 35% on Tuesday in reaction to two press releases. One PR announced that the "Strategic Review Process" had ended with no deal to sell all or part of the company. The other PR announced that one of JAG's three operating mines was temporarily being put on "care and maintenance" to allow design changes to be implemented, causing this year's production to fall from 160K ounces to 120K ounces.
There were some interesting bits of information in the PR announcing the inability to do a deal. First, although China's Shandong Gold was the company rumoured to be stalking JAG, it seems that Shandong never came close to making a serious bid. Second, a North American gold mining company apparently did come close to making a bid of between $8.20 and $9.45 per share during the first quarter of this year. The prospective acquirer wasn't named, but our guess is that it was either IamGold or Kinross Gold. Third, a few other companies expressed interest in buying parts of JAG, but not the whole company. Fourth, the steep decline in gold-stock prices over the past two months played an important role in preventing a deal from being done.
Although the formal review process has ended, it is still possible that a deal will be done. At this stage it is more likely that a deal will involve the sale of one of JAG's projects than the sale of the whole company.
A good argument can be made that the market has now priced in the worst case scenario for JAG, but considering its valuation relative to the valuations of other gold stocks we still wouldn't put JAG near the top of our shopping list if we were building-up long-term positions in gold stocks. JAG certainly looks cheap, but with almost all gold stocks having been pummeled we are currently spoiled for choice when determining what stocks to buy.
Pretium Resources (TSX and NYSE: PVG). Shares: 95M issued, 101M fully diluted. Recent price: C$13.23
In last week's Interim Update we wrote:
"It is possible that the press release issued by PVG after the close of trading on Wednesday 2nd May combined with the dismal overall market for gold mining stocks will lead to another opportunity to buy PVG shares near support at C$13. We are referring to the announcement that PVG has arranged to sell about $60M of new shares.
There is no guarantee that PVG will drop back as far as support in the low-C$13 area. There is also no guarantee that support at C$13 will hold if tested. It isn't reasonable to expect any guarantees, but it is reasonable to attempt to do most of your buying when prices are fundamentally and technically stretched to the downside.
Buy PVG shares if presented with the opportunity to do so in the low-C$13 area."
The company has since managed to sell about 5.5M new shares at C$14.50/share, thus raising about $80M and reducing the risk. There was sufficient demand for the shares offered in the financing to cause the underwriters to exercise their over-allotment option, but this didn't prevent the stock price from falling back to support in the low-C$13 area in reaction to the sector-wide malaise.
Based on what is now known about PVG's Brucejack gold project versus what was known back then, PVG offers much better value at around C$13.00 today than it did when it first reached this level last September. A spike below C$13 wouldn't surprise us, but we wouldn't bet on being able to buy the shares at a significantly lower level.
If we were only allowed to own one gold stock, this would be it.
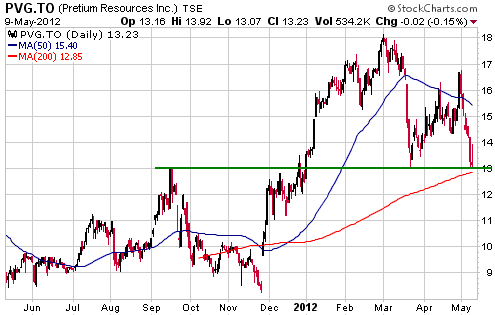
Chart Sources
Charts appearing in today's commentary
are courtesy of:
http://stockcharts.com/index.html
http://bigcharts.marketwatch.com/

|
