|
- Interim Update 9th July 2003
Gold and
the Stock Market
Sometimes we worry that we are throwing
too many alternative scenarios at our readers and, in doing so, creating
an unnecessary amount of confusion. It would be nice to be able to lay
out in clear, concise terms, what we think is going to happen and why it
is going to happen that way. It is usually possible for us to do exactly
that as far as our longer-term (12 months or longer) views are concerned,
but when it comes to the shorter-term stuff our level of uncertainty is
typically greater. This is because the shorter the time frame the more
random the market movements tend to be (on any given day it is often difficult
to distinguish the 'signal' from the 'noise'), and also because the financial
markets are extremely deceptive. In particular, on a day to day, week to
week or even month to month basis, the markets will usually behave in a
way that stops most market participants from understanding the big picture.
As such, during long-term bear markets there are enough rallies of sufficient
magnitude to keep hope alive most of the way down, and during long-term
bull markets there are enough gut-wrenching pullbacks along the way to
keep most participants, even the correctly bullish ones, from fully committing
to the uptrend.
For the reasons laid out in detail
in many commentaries over the past 3 years, we are confident that the gold
price is headed MUCH higher and that the major US stock indices are headed
MUCH lower. And, as each month goes by the evidence that these views are
correct continues to pile up. However, the gold and stock markets are doing
a very good job at the moment of concealing how they are going to get from
where they are now to where we expect them to be in 12 months time.
The fact that the paths to be taken
by both the gold and stock markets over the next few months are
less than clear is not surprising because all the major markets (stocks,
bonds, currencies, gold and commodities) are inter-related. In other words,
the firmer our grip on what is going to happen with the gold market over
the next 3 months the better our chances of figuring out how the stock
market drama is going to play out over the same period. Fortunately, although
we can't know exactly how the gold market's correction is going to unfold
and, therefore, when the next leg in gold's bull market is going to begin,
we have been able to establish some guidelines. These are:
1. From a seasonal perspective, the
most likely times for a low in the gold price are July-August and October-November.
2. The rally in the US$ shows signs
of being shallow and short-lived, suggesting that a major downturn in the
gold price is not on the cards.
3. At the recent peak in the gold market
the small traders did not have a large net-long position in gold futures,
meaning that there were not a lot of weak hands in the market.
Taken together, the above suggest that
the gold price will reach its correction low over the coming month or so
and that this next low will be above the previous low (reached in early
April when spot gold traded down to around $320). Also, given gold's cyclical
tendencies a reasonable assumption is that there will be a low in August
and another (higher) low in October-November.
We are now going to do our best to
avoid creating more confusion while throwing some more potential scenarios
your way.
There is a tendency for the S&P500/gold
ratio (the S&P500 Index measured in terms of gold ounces) to reach
important peaks at around the same time as, or before, the gold price is
making an important low. Therefore, if our gold market view is close to
being correct then regardless of what happens to the nominal S&P500
Index, the S&P500 Index in terms of gold is likely to have peaked by
the time the gold price reaches its next correction low. That is, even
if the S&P500 Index continues to rally for several more months (something
we don't expect, by the way) the S&P500/gold ratio is likely to peak
some time between now and the end of August.
The below chart compares the S&P500/gold
ratio with the gold price over the past 5 years and shows projections based
roughly on what we've discussed above. As far as the stock market is concerned,
these projections show what we consider to be the most bullish outcome.
An equally likely alternative to the outcomes illustrated on the below
chart is that the next low in the gold price will be followed by a rally
to a new high for the year (as opposed to the on-going consolidation shown
on the chart). In this scenario, a July-August peak for the S&P500/gold
ratio would be followed by a major decline rather than the extended topping
process represented on the chart.
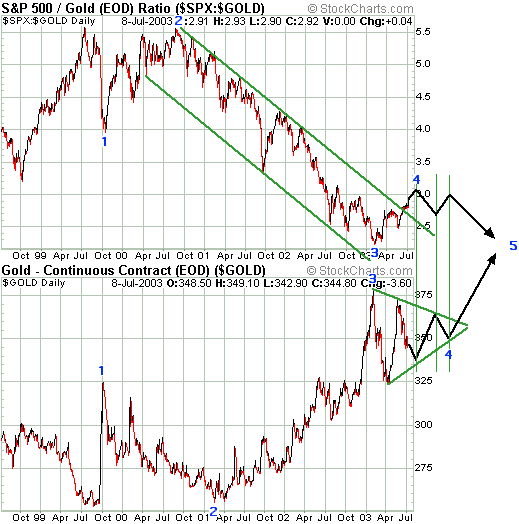
As an aside, the above chart shows
an Elliott Wave (EW) interpretation of the action in both the S&P/gold
ratio and the gold price over the past 4 years. Our experience has been
that EW analysis has little value as a forecasting tool, but it can be
very useful in explaining what has happened in the past. Furthermore, it
can also be used to explain what is likely to happen in the future in
those situations where one has already developed a high-confidence view
via non-EW methods. We certainly do have high-confidence views
regarding the longer-term outcomes for the gold and stock markets and have,
on the above chart, shown how an EW analysis would mesh with these views.
The US
Stock Market
Microsoft just sounded the death
knell for the great stock-option scam
The reported financial results for
many US companies, particularly the large-cap technology companies, have
been given a substantial boost over the past 10 years by the fact that
a lot of employee compensation has been in the form of stock options. Earnings
have benefited because most companies have not expensed the value of these
options in their financial reports to shareholders and the media. At the
same time, cash-flows have been boosted because the companies were permitted
to deduct the value of options from their incomes for tax purposes. This
was all totally legal, but it was/is a scam because either stock options
are an expense or they are not. If they are an expense then the associated
cost of the options should be deducted from the earnings reported to shareholders
and the media as well as from the earnings reported to the IRS. If they
are not an expense then they should not qualify as a tax deduction. As
an illustration of how significant the option scam was/is, Cisco Systems
has been a very profitable company and was briefly the world's largest
company in terms of market capitalisation. However, had stock options been
correctly expensed then Cisco would not have made a single cent of profit
over the past 5 years.
Microsoft was one of the pioneers of
the large-scale use of stock options so it is fitting that MSFT has probably
just signaled an end to the practice. In an announcement on Wednesday MSFT
stated that it would no longer be issuing employee stock options. Instead,
it will be issuing restricted stock (stock that will vest over time if
the employee remains with the company). Furthermore, MSFT confirmed that
all equity-based compensation (the existing stock options and the restricted
stock issued in the future) would be expensed from now on.
The management of companies such as
Cisco (the ones that don't have profits in the absence of the stock-option
scam) are no doubt going to resist the move towards option expensing for
as long as possible, but the tide has turned.
Current Market Situation
From the e-mail alert sent to subscribers
following Monday's stock market surge: "...stock markets throughout
the world were very strong on Monday. Monday rallies are often suspect,
but even though almost all of the upside in the major US stock indices
occurred during the first 2 hours of trading there were definitely some
bullish developments during yesterday's session. In particular, the NASDAQ100/Dow
ratio moved to a new recovery high. This suggests that the S&P500 Index
is still at least a few weeks away from a major peak. Also, the Semiconductor
Index (SOX) made a new closing high for the move.
One possibility we haven't discussed,
because it didn't seem at all likely prior to yesterday's trading, is that
the stock market will surge to a 'blow-off top' over the next 1-2 months.
Such an outcome would set the scene for a spectacular collapse over the
ensuing months. We'll discuss this prospect in more detail in Thursday's
Interim Update if the market is able to hold, or build on, Monday's gains."
Below is a 2-year chart of the NASDAQ100/Dow
ratio. The NDX/Dow ratio is the indicator we've watched more closely than
any other over the past 6 months because it has consistently moved lower
during the final stages of rallies in the market and during the early stages
of major declines. Another way of saying this is that the NASDAQ100 Index
tends to gain downward momentum first during the major declines and lose
upward momentum first during the final stages of counter-trend rallies.
So, as long as the NDX/Dow ratio is making new highs it is reasonable to
assume that the overall market has not yet reached its ultimate peak. Therefore,
this week's surge to a new high by the ratio suggests that both the S&P500
Index and the Dow Industrials Index are probably at least a few weeks away
from their ultimate highs.
Note that the below chart also includes
a 70-day moving average. Why 70 day? Because this is the number that has
given the best results in terms of confirming trend changes over the past
2 years. Whenever the NDX/Dow ratio has crossed its 70-day MA over the
past two years it has proven to be a timely warning that either a substantial
rally was underway (when the ratio has crossed from below to above this
MA) or that a major decline was about to commence (when the ratio crossed
from above to below this MA).
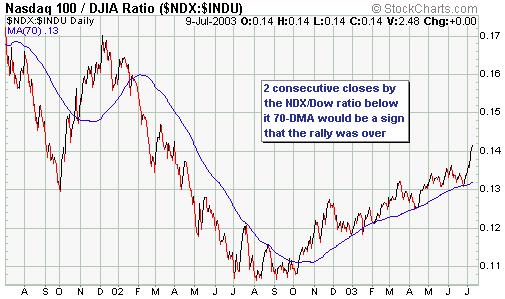
As mentioned in this week's e-mail
alert, the new highs in the NDX/Dow ratio mean that a 'blow-off top' is
possible in the market over the next several weeks (a blow-off top occurs
when a market that has been trending higher for an extended period goes
'vertical' for a few weeks). Blow-off tops always end in major trend reversals,
so beyond the short-term such an outcome wouldn't be bullish. Like crashes
they are, however, quite rare, so even though the door is now open for
such a move we don't consider it to be the most probable outcome.
There are enough bearish divergences
on the go at the present time for us to think that a pullback remains the
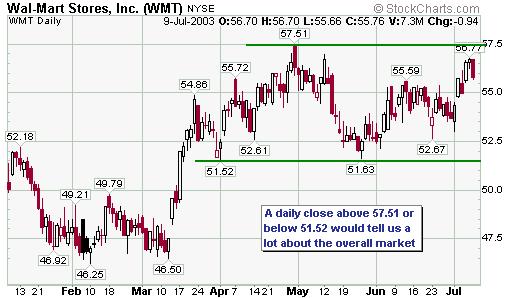
most likely short-term outcome. For example, the General Electric stock
price has been noticeably weak of late (GE is the world's largest company
in terms of stock market capitalisation) and the Walmart stock price remains
comfortably below its April peak (Walmart is the world's largest company
in terms of annual sales). If the overall market were going to rocket higher
over the next six weeks then Walmart should be making new highs right about
now. As things currently stand WMT is in 'no man's land' between resistance
and support. A move outside the 51.50-57.50 range shown on the below chart
is needed to tell us anything meaningful about the overall market situation.
We will continue to hold the December
put options that are currently in the TSI Stocks List. In the event that
the market does experience an upside blow-off over the next few weeks these
options will lose most of their remaining value, but they would fully recover
during the subsequent collapse. In the event that the market pulls back
over the next few weeks but does not provide us with evidence that a major
decline is underway (e.g., via the NDX/Dow ratio moving below its 70-day
MA), we will exit the puts. Lastly, if we do see evidence that a major
decline is underway we will probably add more put options to the Stocks
List.
As an aside, we generally consider
speculations in out-of-the-money options to be 'all or nothing bets'. Consequently,
the amount of money put at risk in any such speculation should always be
small enough that a 100% loss can be taken without causing any emotional
or financial discomfort. In the coming Weekly Market Update we'll deal
with risk management practice as it specifically relates to options trading.
Gold and
the Dollar
Gold in terms of 'other' currencies
The below chart shows the US$ gold
price multiplied by the US$ Index, so it effectively shows how the gold
price has performed in terms of major currencies other than the US$. This
chart indicates that the relative value of gold has, over the past 4 years,
risen in terms of fiat currency in general rather than just in terms of
the US$ (if every one percent fall in the Dollar Index over the past 4
years had resulted in a one percent rise in the gold price, the chart would
show a horizontal line).
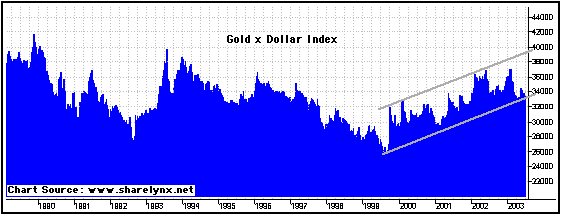
With reference to the above chart,
notice the big difference between the price action of the past 4 years
and what happened throughout the 1990s. In a bear market a steady trend
towards lower prices tends to be punctuated by sharp rallies, whereas in
a bull market a steady trend towards higher prices tends to be punctuated
by sharp declines.
Current Market Situation
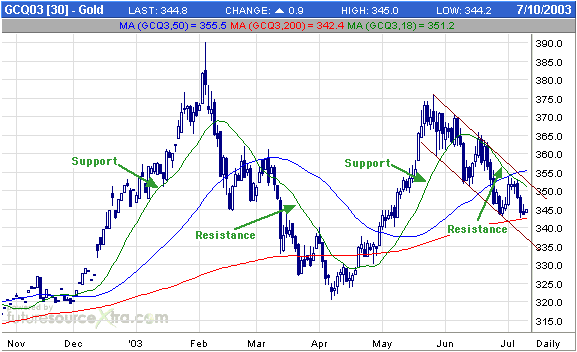
Below is a daily chart of August gold
futures. As has been the case for about 8 months now, the 18-day moving
average continues to act as support during the medium-term uptrends and
as resistance during the medium-term downtrends. We expect the gold price
correction to continue over the next few weeks, but if August gold achieves
two consecutive daily closes above its 18-day MA (currently at $351.20)
then we will assume that a bottom is in place. In the mean time, gold has
short-term downside risk to around $335.
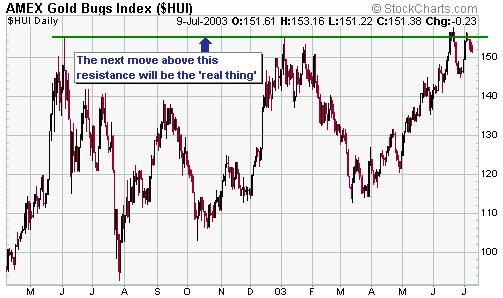
Below is a chart of the AMEX Gold BUGS
Index (HUI) covering the now 14-month long consolidation period. When the
HUI moved to a marginal new high on 17th June we didn't think it was signaling
the start of a major advance (refer to the "Gold Stocks" discussion in
the 18th June Interim Update). Apart from the fact that a continued surge
in the gold stocks at that time wouldn't have been consistent with what
we expected to happen in the currency market, the straight-line nature
of the move up to resistance meant that immediate follow-through was unlikely.
The current consolidation is, however, setting the stage for a powerful
advance. The HUI will probably move below its recent low of 144 before
it breaks above the major resistance at 154-156, but regardless of how/when
it happens we expect that the next break above resistance will confirm
that a major rally is underway.
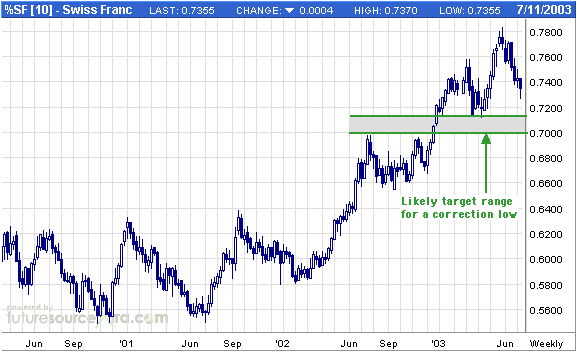
Below is a weekly chart of Swiss Franc
futures. Our downside target for the current correction has been the 0.70-0.72
support range, and that remains the case. However, the SF probably won't
get there in a straight line.
The silver price has once again moved
up to resistance in the 4.80-4.90 range. Our view has been that the next
test of this range would be unsuccessful, that is, that silver's next visit
to this resistance would result in an upside breakout. However, we are
skeptical of silver's short-term upside potential here due to the straight-line
nature of the recent advance. This just means that a short period (1-3
weeks) of consolidation in the 4.70-4.90 range will probably occur prior
to a breakout. A daily close above $4.90 (basis the nearest futures contract)
would strongly suggest to us that a major rally in the silver price was
underway.
Update
on Stock Selections
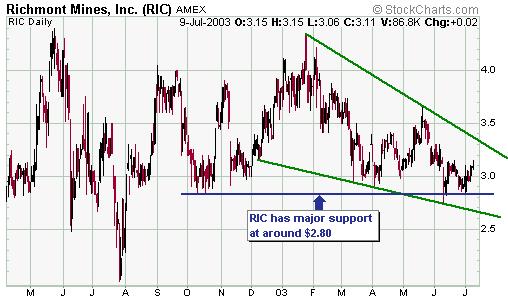
 Richmont
Mines (AMEX: RIC) has announced a buyback of up to 5% of its outstanding
shares. Stock buybacks are usually bullish, so this is a positive development.
RIC is excellent value by most measures, but has low reserves and resources.
If it can significantly increase its gold reserves, either via exploration
success or acquisition, its stock price would probably move much higher.
In the mean time, given the cheapness of the shares the stock buyback is
a good use of some of the company's substantial hoard of cash. With the
stock price only about 10% above major support, RIC is a relatively low-risk
buy near its current level. Richmont
Mines (AMEX: RIC) has announced a buyback of up to 5% of its outstanding
shares. Stock buybacks are usually bullish, so this is a positive development.
RIC is excellent value by most measures, but has low reserves and resources.
If it can significantly increase its gold reserves, either via exploration
success or acquisition, its stock price would probably move much higher.
In the mean time, given the cheapness of the shares the stock buyback is
a good use of some of the company's substantial hoard of cash. With the
stock price only about 10% above major support, RIC is a relatively low-risk
buy near its current level.
Shares
of Northgate Exploration (TSX: NGX) will begin trading on the AMEX on 11th
July under the symbol NXG. From a technical perspective, the stock is currently
sitting at resistance. A daily close of C$1.60 or higher would suggest
that NGX was going to make it to around $1.90 before the next significant
pullback occurred. The stock has short-term downside risk to around $1.30,
but the path of least resistance appears to be up.

NovaGold
(TSX: NRI) continues to power ahead, but it will eventually pullback. After
a stock breaks above a downtrend it will often drop back to its former
downtrend-line before resuming its upward move. Such a pullback for NRI
over the next few weeks would see the stock price drop back to around C$3.20.
There are, of course, no guarantees that it will pullback this far.
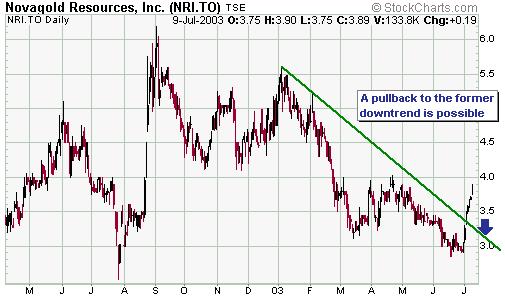
Chart Sources
Charts appearing in today's commentary
are courtesy of:
http://stockcharts.com/index.html
http://www.futuresource.com/

|
