![]()
![]()
![]()
![]()
- Interim Update 9th August 2017
Copyright
Reminder
The commentaries that appear at TSI
may not be distributed, in full or in part, without our written permission.
In particular, please note that the posting of extracts from TSI commentaries
at other web sites or providing links to TSI commentaries at other web
sites (for example, at discussion boards) without our written permission
is prohibited.
We reserve the right to immediately
terminate the subscription of any TSI subscriber who distributes the TSI
commentaries without our written permission.
Oil Update
Recapping the bearish
oil supply situation
In the 17th May Interim Update we
wrote that the supply side of the supply-demand equation was now more
bearish for the oil market than for any other commodity market, the reason
being the ability and willingness of the US shale-oil industry to quickly
ramp-up supply in response to a higher price. Evidence in support of this
statement is provided by the market response over the past 18 months to
rising commodity prices.
On the one hand we have the zinc market,
where a strong upward trend in price has done almost nothing yet to
alleviate a tight supply situation. In fact, the supply situation in the
zinc market is more bullish today with the zinc price at around
US$1.30/pound than it was 18 months ago when the price of the metal was
around US$0.80/pound.
On the other hand we have the oil market,
where a strong upward trend in price during February-December of last year
prompted a large increase in drilling activity within the US shale-oil
industry, leading to a significant increase in production. Furthermore,
even though the oil price has drifted downward during the course of this
year it has clearly remained high enough to generate profits for many US
shale-oil-focused producers. We say this because during this year to date
the Baker Hughes Oil Rig Count (see chart below) has extended the steep
rise that began last year.
The rig count is still a long way below its average level of
2012-2014, but this is not a reason to be optimistic about the oil price.
The following chart of US daily oil production illustrates why. Notice
that even though the rig count is currently less than half its 2014-2015
peak, production has nearly returned to its 2014-2015 peak. Moreover,
there's a good chance that production will exceed its 2014-2015 peak
within the next 6 months regardless of what happens to the oil price.
Taken together, the two charts displayed above point to a very
impressive increase in productivity. Specifically, the charts indicate
that productivity per rig has roughly doubled over the past few years.
This is why oil drillers that needed an oil price of more than $70/barrel
a few years ago just to break even are now profitable at $45-$50/barrel.
For the reasons outlined above and in earlier commentaries, we suspect
that it will take an extraordinary event, such as a region-wide
conflagration in the Middle East, to get the oil price above $60/barrel
(in 2017 dollars) for more than a brief period. However, 3-12 month trends
in the oil price are driven to a greater extent by what's happening in
other markets, most notably the currency market, than what's happening to
oil supply. That's why we are expecting an intermediate-term rally in the
oil price from whatever low is made over the coming three months.
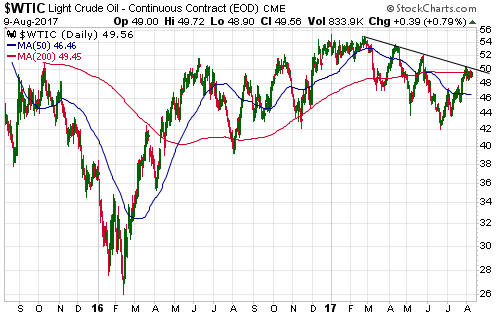
Oil's price action
The oil price made its most
recent bottom in June and has since rebounded as far as it can without
signaling an upward trend reversal. A daily close above $51 would be such
a signal.
We think that the oil price is close to a top that will
hold for at least a couple of months and that the next 10% move will be to
the downside. Also, there is still a risk of a decline to below $40 prior
to the start of the next intermediate-term rally, although the more likely
scenario is that the June low will turn out to be the low for the year.
The Stock Market
Close to the highest
valuation in history
From John Hussman's
latest Weekly
Comment:
"The most reliable market valuation measures we
identify (those most strongly correlated with actual subsequent S&P 500
10-12 year total returns) now exceed every point in history except the
extreme reached in the single week of the final high March 24, 2000."
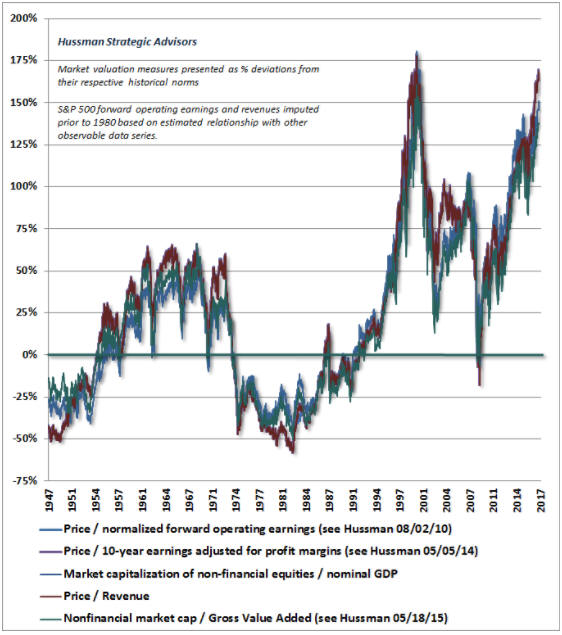
Valuation is an exceedingly blunt tool to use when trying to determine
what the stock market will do over the next several months, but a high
valuation creates downside risk and the highest valuation in history
suggests the scope for an unusually-large price decline. We hasten to
mention, though, that we are currently not betting that an unusually-large
price decline will soon get underway. What we are betting on is a decline
of at least 10% within the coming 2.5 months.
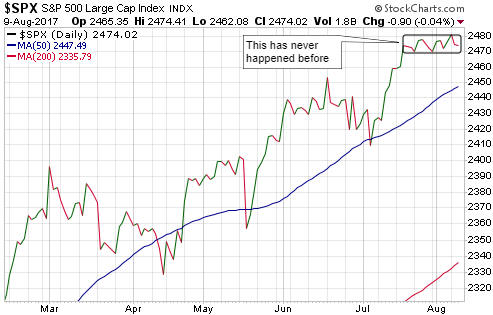
Putting some
numbers to the low volatility
With its 0.24% decline in
Tuesday 8th August, the SPX had gone 14 trading days without moving by
more than 0.30% in either direction. To put this into perspective, in data
going back to 1927 the previous record of consecutive daily moves of 0.30%
or less was ten. That's according to a Deutsche Bank analyst (Jim Reid).
Trump then came out with his crazy "fire and fury the likes of which
have never been seen" threat against North Korea, but even that wasn't
enough to bring about a daily move of more than 0.30% by the SPX. In fact,
the SPX ended Wednesday's session almost unchanged, increasing its
record-breaking sequence of trivial daily changes to 15.
The work of the same DB analyst tells us that as of 9th August the SPX
had gone 75 trading days without a daily gain of more than 1%. Over the
past 20 years the current run without a daily gain of at least 1% was only
exceeded between November-2006 and March-2007, when the SPX went 80 days
without such a daily gain.
The stock market is like a pendulum,
with periods of low volatility inevitably being followed by periods of
high volatility and periods of high volatility inevitably being followed
by periods of low volatility. The difference is that in the stock market
the swings from one extreme to the other don't occur at regular or
predictable intervals.
Interesting developments
Not much happened over the first three days of this week, but there
were two developments worth highlighting.
First, even though the
NASDAQ Composite Index reached its all-time high as recently as two weeks
ago and remains within 2% of its peak, on Wednesday 9th August there were
119 new 52-week lows by NASDAQ-traded stocks versus only 41 new 52-week
highs. As illustrated by the red bars on the lower section of the
following chart, the number of individual-stock new lows on 9th August was
the highest since the start of the post-election upward trend in
early-November of last year. This reflects internal weakness.
Second, the EURO STOXX 50 Index (STOX5E) has moved sideways since the
end of June, but reversed lower from its 50-day MA early this week and is
now precariously poised above short-term support. A breach of support at
3450 would likely be followed by a quick decline to around 3350.
Gold and the Dollar
Gold
The
US$ gold price gained $17 on Wednesday 9th August and managed to trade at
its highest level since early-June. Wednesday's price action didn't
significantly alter the chart pattern, though. To significantly alter the
chart pattern the gold price would have to close above resistance at
$1300. Also, Wednesday's price gain appears to have been a reaction to
Trump's "fire and fury" comment, which makes it suspect given that the
gold price never sustains gains that are driven by geopolitical conflict
or fear of same.
That being said, the fundamental backdrop was already gold-bullish
prior to Trump's latest threat to obliterate North Korea and regardless of
geopolitical issues will become increasingly so if economic confidence
declines over the weeks ahead. It is therefore possible that the US$ gold
price will soon break out to the upside. However, there is also a risk
that it will drop back to near the bottom of its 4-month trading range
before the next meaningful rally begins.
Note that for a breakout
in the gold price to be considered genuine/sustainable it would have to be
confirmed by a breakout in the gold-mining sector.
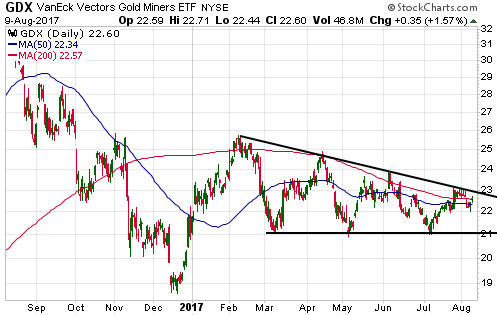
Gold
Stocks
In effect, the gold-mining sector has been coiling
since February. This is evidenced by GDX's well-defined contracting range.
As illustrated below, the price action over the first three days of this
week didn't change anything.
In addition to tracing out a form of 'coiling' pattern since its
February peak, GOEX, our preferred ETF proxy for the junior end of the
gold-mining universe, has also traced out a shorter-term coiling pattern
since mid-May. This pattern is the narrow rectangle drawn on the following
daily chart. A breakout would require a daily close above $23.00 or below
$21.20.
The question is: Will the coiling patterns end in upside or downside
breakouts?
With the fundamental backdrop currently being
gold-bullish and having the potential to move further into bullish
territory over the weeks ahead, we can make a reasonable case for an
upside breakout. However, we can also make a case for a 'deck-clearing'
plunge prior to the start of a tradable rally.
Fortunately,
there's no need to try to guess the answer to the above question because
prices won't have to move far from current levels to provide a conclusive
answer.
Updates on Stock Selections
Notes: 1) To review the complete list of current TSI stock selections, logon at
http://www.speculative-investor.com/new/market_logon.asp
and then click on "Stock Selections" in the menu. When at the Stock
Selections page, click on a stock's symbol to bring-up an archive of
our comments on the stock in question. 2) The Small Stock Watch List is
located at http://www.speculative-investor.com/new/smallstockwatch.html
![]() Exiting
Nevsun Resources (NSU)
Exiting
Nevsun Resources (NSU)
We added NSU to the TSI Stocks List
only two weeks ago with the idea that it would be a 3-9 month trade, but
the quarterly results published by the company after the close of trading
on Wednesday 9th August have prompted us to remove it.
There are
two main issues. First, the Bisha project is performing worse than
expected and could be a significant drain on the company's cash for at
least the next two quarters. Bisha accounts for about one-third of our NSU
valuation. Second, completion of the Timok project PFS has been delayed by
a few months -- from early in Q4-2017 to sometime in Q1-2018. Timok
accounts for the other two-thirds of our NSU valuation and the PFS was
expected to be a positive short-term catalyst.
NSU ended
Wednesday's session at US$2.62, which is roughly the price at which it was
added to the List two weeks ago. However, the price will fall on Thursday
in reaction to Wednesday's news. For TSI record purposes the exit price
will be adjusted to reflect where the stock trades on 10th August, as long
as it trades at US$2.40 or above.
We may return to NSU within the
next few months, as the Timok project has one of the world's best
undeveloped copper deposits and should eventually attract a premium
valuation.
 A rank speculation on a gold discovery
Over the
past four weeks there has been crazy speculation in the shares of Novo
Resources (NVO.V). The stock was trading at around C$0.80 in early July
when it became apparent, initially via a Youtube video and subsequently
via an official press release, that the company had found gold nuggets in
primary conglomerates in the first trench at its 50%-owned Purdy's Reward
prospect in Karratha, Western Australia. In the 12th July press release
that confirmed this discovery the company advised that it had collected a
small bulk sample of these gold-bearing conglomerates for analytical test
work. Although the results of the bulk sample were positive it looks like
the 8th August press release that reported these results marked a
short-term top for the stock. On this day NVO traded as high as C$3.30. It
has since pulled back to C$2.83.
At C$2.83/share, NVO has a market cap of about C$340M. Considering the
very early stage of its exploration work at Purdy's Reward and its other
prospects in the northern part of Western Australia, this is an extremely
high valuation. With what's presently known about the company's assets,
near its current valuation we wouldn't touch NVO shares with a 10-foot
barge pole.
In effect, what happened over the past few weeks was
that stock speculators boosted NVO's market cap by about C$250M in
response to the company finding a few gold nuggets using a metal detector.
Now, there is obviously more gold in the area, but there would have to be
a LOT more to justify the current market cap and it would have to be
possible to economically extract the gold. Moreover, it will probably take
years and tens of millions of dollars of exploration work to define the
resource, assuming that a substantial resource even exists. In other
words, speculators in NVO shares got way ahead of the reality on the
ground, to put it mildly.
There is, however, a reasonable stock
speculation associated with this potential gold resource, just not
currently in NVO shares. The reasonable speculation is in the shares of
Artemis Resources (ARV.AX), the Australian company that owns the other 50%
of Purdy's Reward.
With 464M shares outstanding (including
in-the-money options that will soon be exercised) and a share price of
A$0.14, ARV is presently being valued by the stock market at about A$65M.
For this A$65M an investor gets 50% of the asset that resulted in the
recent frenzied speculation in NVO shares plus a few other
potentially-valuable assets including a gold processing plant and the
largest tenement package in Karratha. Some introductory information about
these assets can be found
HERE.
The following chart shows that, like NVO shares, ARV
shares were given a hefty boost by the recent speculation linked to
Purdy's Reward. However, the stock price has already pulled back sharply
from its high and, as mentioned, the market cap is MUCH smaller.
There are 68M ARV warrants with an exercise price of only A$0.02 that
expire at the end of next month. Trading associated with the exercising of
these warrants could create opportunities to buy ARV shares at lower
prices over the coming 1-2 months, but if you are interested in this
high-risk speculation then it would probably make sense to take an initial
position near the current price (A$0.14) with the aim of adding on
weakness.
We have added ARV to the TSI Small Stock Watch List.
Chart Sources
Charts appearing in today's commentary
are courtesy of:
http://stockcharts.com/index.html
http://bigcharts.marketwatch.com/
http://www.investing.com/
![]()