![]()
![]()
![]()
![]()
- Interim Update 9th September 2020
Copyright
Reminder
The commentaries that appear at TSI
may not be distributed, in full or in part, without our written permission.
In particular, please note that the posting of extracts from TSI commentaries
at other web sites or providing links to TSI commentaries at other web
sites (for example, at discussion boards) without our written permission
is prohibited.
We reserve the right to immediately
terminate the subscription of any TSI subscriber who distributes the TSI
commentaries without our written permission.
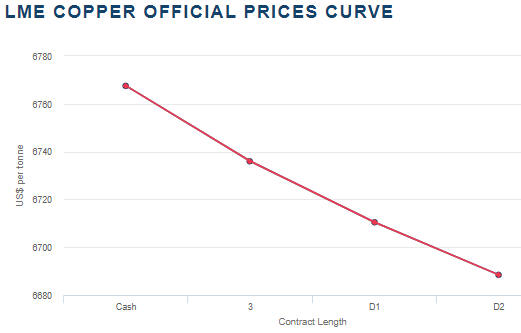
Copper in short supply
The total amount of copper
stored in LME warehouses has dropped to the lowest level in at least 15
years. To put the current LME copper inventory into perspective, it is
much less than a single week's copper consumption in China.

The reported LME warehouse inventories are subject to manipulation and
often do not reflect the overall supply situation in the metals markets.
In the current case of copper, however, the unusually low level of the
reported LME inventory does appear to be indicative of a commodity in
short supply. One reason is that the LME futures curve (see below) for
copper has a downward slope from the present through to December-2022 (D2
on the following chart). This means that the copper market is in
backwardation, which usually only happens when physical supply is tight.
Another reason is the ability of the copper price to hold near US$3.00
in the face of stock market weakness, general commodity market weakness
and US$ strength over the past several trading days.
The bullish supply-demand situation for physical copper won't prevent
a price correction, especially if there is a significant rebound in the
US$. However, it suggests to us that the short-term downside risk is less
than 10%.
Survivorship bias
at work?
The following chart shows that
the National Federation of Independent Business (NFIB) Small Business
Optimism Index is close to its long-term average and higher than it was
throughout the economic expansion period of 2010-2016. Given the current
economic backdrop this doesn't make sense, but "survivorship bias" could
be distorting the picture.
Survivorship
bias is the logical error of concentrating on the people or things
that made it past some selection process and overlooking those that did
not, typically because of their lack of visibility. In this case, we think
that what's being overlooked is the large number of businesses that have
gone bust and therefore dropped out of the survey. For example, about 30%
of the restaurants in New York City have closed their doors permanently
since the lockdowns were imposed in March. A current survey of New York
restaurants would not include these establishments.
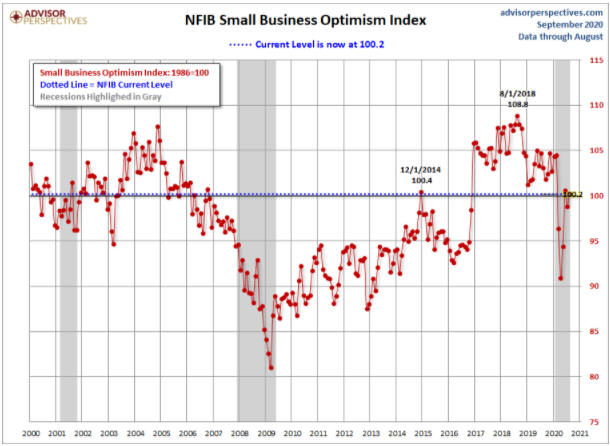
Source:
advisorperspectives.com
The Stock Market
More thoughts on the
Presidential Election Effect
In the 17th August Weekly
Update we wrote that beyond short-term reactions (a 'pop' in response to a
Trump victory and a plunge in response to a Biden victory), the outcome of
the US election scheduled for 3rd November might not matter as much as
most people believe. Regardless of who wins the political race in
early-November of this year, massive government spending and central bank
money-pumping probably will support the overall stock market, and
especially the cyclical sectors of the stock market, for 2-3 quarters
after the election. Also, regardless of the election result a major
stock-market downward trend probably will get underway by the middle of
next year.
Our view hasn't changed, although in our earlier
discussion we didn't mention the biggest election-related threat to the
stock market. Our earlier discussion was predicated on the assumption that
a winner would be known within days of the election taking place, but
there is a risk that it will be weeks or even months after election day
before one side or the other concedes defeat. For the stock market, this
would be the worst-case scenario for two reasons. First, it would prolong
the uncertainty and prevent many investors from attempting to discount
future government policy, leading to reduced market liquidity and larger
weekly price swings. Second, it could delay the spending programs that
both parties are planning for 2021.
The situation could look very
different by the time November rolls around, but based on what we know
today we think it will make sense to be positioned defensively (meaning:
not aggressively long or short) going into the US election and to remain
defensive until the result is clear.
Vaccine news and the
biotech sector
News hit the wires on Tuesday that the
AstraZeneca/Oxford phase 3 COVID-19 vaccine trial had been put on hold due
to an unexplained serious illness (subsequently reported as being
Transverse Myelitis) in one of the trial participants. Other vaccine
trials are on-going, but the AstraZeneca/Oxford vaccine had been described
by the World Health Organization as the world's leading candidate.
The issue encountered in the AstraZeneca/Oxford vaccine trial is
significant not only because it will delay one potential vaccine, but also
because it will reduce the public's confidence in whatever vaccine makes
it through the approval process. We suspect that the majority of people
will be unwilling to take the first generation of any government-approved
vaccine, so in most parts of the world it will be a long time before there
is "herd immunity".
Given the widespread fear regarding the
coronavirus and the massive resources that have been channelled into the
development of vaccines and treatments for the virus, it isn't surprising
that the biotech sector of the stock market was a relative strength leader
between mid-March and mid-July. What is perhaps a little surprising is
that the biotech sector, as represented on the following daily chart by
BBH, appears to have made an intermediate-term top in mid-July and is now
testing its lows of the past 4 months. This probably reflects the reality
that most biotech and pharmaceutical companies will not make money from
the coronavirus and that the overarching focus on this virus has detracted
from work on other medical/health issues.
We don't pay much
attention to the biotech sector and have no opinion regarding its
short-term or intermediate-term prospects. We do note, though, that BBH
has major support in the $140s and short-term resistance in the $160s.
This suggests to us that the $160s is a likely area for a short-term
rebound to end and that the $140s is a likely area for the
intermediate-term correction to end.

Current Market Situation
In the US stock
market, the sell-off that began last Thursday continued on Tuesday of this
week (the first trading day of the holiday-shortened week). This enabled
the SPX and the NDX to close below last week's low on Tuesday and for the
NDX to reach is 50-day MA.
This is the first time the NDX has
traded at its 50-day MA since April, with all previous pullbacks over the
past 4.5 months having ended near the 20-day MA. Consequently, for the NDX
this is already the most significant correction since the March low.
The oil sector of the stock market held up well in the face of
weakness in both the SPX and the oil price late last week, but it took a
hit on Tuesday of this week. Tuesday's plunge was caused by the government
of Saudi Arabia announcing a cut in the price of its exported oil at a
time when the oil market was technically vulnerable. However, other
cyclical sectors of the stock market have continued to show the same
resilience that was evident during last week's general market sell-off.
For example, the following chart shows that the Dow Transportation Average
(TRAN) remains close to its high for the year.
Also worth mentioning is that the Volatility Index (VIX) did not
exceed last week's high during Tuesday's selling squall and has dropped
back to the high 20s. As a result, last week's volatility spike looks
similar to the June volatility spike.
Tuesday's closes below last week's lows by both the SPX and the NDX
warn that a 10%+ correction could be underway for these indices, but after
underperforming for a couple of months the overall market now looks
stronger than the mega-cap tech stocks that dominate the NDX and to a
lesser extent the SPX.
Gold and the Dollar
Gold and Silver
The US$ gold price continues to test support near $1920 without
closing below it. On each of the past two trading days it traded at/below
this support and then rebounded, with Wednesday's rebound being capped by
the 20-day MA. This means that it is showing some resilience, but not
showing any real strength.
The upshot is that the following comment
from the latest Weekly Update remains applicable:
"A solid
break below US$1920 probably would pave the way for a correction low
during October, but until support is breached there will be a realistic
chance that the price action since early August was a mid-trend
consolidation rather than a topping pattern."
Like gold, silver is showing resilience but not much strength. It
managed to hold above short-term lateral support at US$26.00 over the past
two trading days while being capped by its 20-day MA.
A rebound
within the context of a developing top could take the price up to the
$28-$29 range over the days ahead, while a daily close below $26.00 would
signal that a decline to below the August low and possibly as low as the
200-day MA had begun.
Gold Stocks
In the latest Weekly Update, we
wrote:
"The HUI's price action since its early-August high
currently looks more like a mid-trend consolidation -- similar to what
happened between mid-May and mid-June -- than a topping pattern. However,
the strong tendency for the HUI to set a multi-quarter extreme between
early-August and early-September is a cause for concern. The
August-September cycle warns that the next 15%+ move will be to the
downside.
A new high for the year within the next few days still
would be consistent with the August-September cycle, but a new high for
the year after this week would indicate that the August-September cycle
did not work this year and that the intermediate-term upward trend had
resumed. A daily close below 320 would validate the August-September cycle
and indicate that a decline to an October-November low was underway."
Due to what happened over the past two trading days the HUI's price
action now looks even more like a mid-trend consolidation. As illustrated
by the following daily chart, the HUI traded slightly below its 50-day MA
on Tuesday and then reversed course. It ended Tuesday above this MA and
then gained enough ground on Wednesday to close above its 20-day MA.
The HUI has now spent about four weeks inside its early-August range.
During this period it made a sequence of slightly-lower highs and
slightly-higher lows, a coiling pattern that is more often associated with
a mid-trend consolidation than a top.
We are still in the
time-window for a multi-month high, but that window will close this week.
A new high for the year after this week will suggest that the
intermediate-term upward trend has resumed. If that happens we probably
will remove most of our hedges.
Note that the short-term chart patterns of the gold mining
indices/ETFs are more bullish than the short-term chart patterns of gold
and silver bullion. One way or the other the charts should move into line
with each other within the next couple of weeks, either by the metals
following the equities higher or the equities following the metals lower.
The Currency Market
The following daily chart
shows that over the past month the Dollar Index (DX) moved from the bottom
to the top of its short-term downward-sloping channel essentially by going
sideways. Needless to say, to date the rebound has been unimpressive.
A stronger rebound -- within the context of a longer-term decline that
should extend well into next year -- is expected and would be signalled by
a daily close above 94. The 94 level looks significant because a daily
close above it would break the DX above short-term lateral resistance, the
short-term channel and, if it happened after this week, the 50-day MA.
A break above 94 would suggest short-term upside targets of 95.5-96.0
and 97.5-98.0. The DX should make it to the former and could make it to
the latter of these target ranges before resuming its longer-term decline.
However, as things stand right now there is a risk that the DX will
make a new low for the year before commencing a meaningful rebound. This
could happen due to US election-related uncertainty and/or a further
near-term rise in US inflation expectations.
Updates on Stock Selections
Notes: 1) To review the complete list of current TSI stock selections, logon at
http://www.speculative-investor.com/new/market_logon.asp
and then click on "Stock Selections" in the menu. When at the Stock
Selections page, click on a stock's symbol to bring-up an archive of
our comments on the stock in question. 2) The Small Stock Watch List is
located at http://www.speculative-investor.com/new/smallstockwatch.html
![]() The
Enable Midstream Partners (ENBL) trading position closed
below our 20% trailing stop loss on Tuesday 8th September and has been
removed from the TSI List. The result of the trade was a profit of 11%.
The
Enable Midstream Partners (ENBL) trading position closed
below our 20% trailing stop loss on Tuesday 8th September and has been
removed from the TSI List. The result of the trade was a profit of 11%.
We remain optimistic about the intermediate-term prospects of this
natural gas distributer and will look for a new opportunity to 'go long'.
 New Century Resources (NCZ.AX), a mid-tier Australian
zinc producer, was added to the TSI List as a trading position in the 8th
June Weekly Update to provide leveraged exposure to zinc and also
potentially to provide leveraged exposure to nickel. The exposure to
nickel required the completion of a deal that involved NCZ acquiring the
Goro nickel mine in New Caledonia from Vale.
New Century Resources (NCZ.AX), a mid-tier Australian
zinc producer, was added to the TSI List as a trading position in the 8th
June Weekly Update to provide leveraged exposure to zinc and also
potentially to provide leveraged exposure to nickel. The exposure to
nickel required the completion of a deal that involved NCZ acquiring the
Goro nickel mine in New Caledonia from Vale.
On Tuesday of this
week NCZ advised that it has decided not to proceed with the Goro
acquisition. In our opinion, this news leaves the stock's risk/reward
unchanged.
As explained in our 8th June write-up:
"We
like NCZ with or without the Goro deal. Without the Goro deal it has good
upside potential (100%-200% within the next 12 months, assuming a rebound
in the zinc price to above US$1.10/pound) and only moderate risk. With the
GORO deal it has much greater upside potential in exchange for much higher
risk."
NCZ is now a pure play on zinc, which is fine. However,
it means that we are now on the lookout for a nickel play for the TSI
List. One possibility is Clean TeQ (ASX and TSX: CLQ), a former TSI stock
selection that provides exposure to cobalt and platinum in addition to
nickel.
CLQ's
Sunrise project in NSW is marginal at current metal prices and the
stock is not particularly cheap (with 746M shares outstanding, at the
current price of A$0.30/share the market cap is about A$220M), but the
company is chaired by Robert Friedland and therefore stands a good chance
of being aggressively promoted under the right market conditions.
Along with many other commodity-related equities CLQ appears to have made
a major bottom in March-2020. It has traced out an intermediate-term
basing pattern, but during the first half of this week it became
short-term 'overbought' due to rapid price rise. It is now in the process
of 'correcting' this rapid rise.
In a recent press release CLQ advised: "...[the company] will
release the final outcomes for its Project Execution Plan (PEP) at the end
of September 2020, including a full economic evaluation of the [Sunrise]
Project. It will incorporate the latest engineering and design work based
on updated material quantities, vendor pricing and labour costs."
Therefore, within the next three weeks we should get some useful
information regarding CLQ's value and potential.
Chart Sources
Charts appearing in today's commentary
are courtesy of:
https://stockcharts.com/
https://www.lme.com/
https://www.kitco.com/
http://bigcharts.marketwatch.com/
![]()