|
- Interim Update 9th November 2011
Copyright
Reminder
The commentaries that appear at TSI
may not be distributed, in full or in part, without our written permission.
In particular, please note that the posting of extracts from TSI commentaries
at other web sites or providing links to TSI commentaries at other web
sites (for example, at discussion boards) without our written permission
is prohibited.
We reserve the right to immediately
terminate the subscription of any TSI subscriber who distributes the TSI
commentaries without our written permission.
Nothing is cheap
John Hussman recently wrote
that Ben Bernanke has done his job well, given that he believes his job is to drive investors into higher-risk assets by starving them of yield on safer investments. Pockets of good value can be found in most markets, but thanks to the efforts of Bernanke and his central banking cohorts all of the major asset classes are now expensive based on traditional metrics. At least, none of them appear to offer great value.
We note, for example, that:
a) The US stock market, as represented by the S&P500 Index, currently has a dividend yield of 2.1%. To put this into perspective, 2.1% is in the bottom one-tenth of the long-term historical range. Furthermore, prior to 1995 the S&P500's dividend yield had NEVER fallen below 2.5%.
b) The yields on 30-year and 10-year Treasury Bonds are currently around 3% and 2%, respectively. These yields provide no compensation whatsoever for the risk that the dollar will lose value due to inflation.
c) The current yield on the Dow Jones Corporate Bond Index is around 3.5%. This means that in return for taking-on default risk, investors in corporate bonds are, on average, receiving a real yield of less than zero.
d) The price of the average house in the US has dropped to a level where it offers reasonable value, but the policies that have been put in place to support house prices and encourage a new stream of 'unqualified' buyers to take out home mortgages will ensure that the market remains moribund for years to come.
e) Over the past 3.5 years some important commodities, chief among them crude oil and copper, made or came close to making new all-time highs in real (inflation-adjusted) terms. Absent a major supply shock, such as a war in the Middle East that crimps global oil production, these will probably turn out to be secular highs. In other words, some of the world's most important commodities have probably seen their best days in real terms. The most they will do from here is rise by enough to offset currency depreciation.
f) Gold just made a new all-time high relative to the Continuous Commodity Index (CCI) and is near an all-time high relative to the average US house, which means that gold is now more expensive than it has ever been relative to commodities in general and is almost as expensive as it has ever been relative to US residential property. Also, relative to the US stock market gold is back to where it was in the late 1980s.
Further to Point f) above, the argument "gold should be bought because it is under-valued" no longer applies. The truth is that gold is no longer under-valued relative to any asset class except bonds.
The valid argument now is that gold should be held or bought because it is likely to become much more expensive. This might seem like an application of the "greater fool theory" (being foolish enough to pay a high price in the hope that a bigger fool will pay an even higher price in the future), but the fundamentals are in favour of gold eventually becoming extremely over-valued relative to most other investments. This is because the policies of central banks and governments are making the alternatives increasingly less attractive. In effect, governments and central banks are unwittingly driving people away from productive investments and towards gold. This
year's deflation scare was small, but next year's could be much bigger
The following chart from the Fullermoney.com Chart Library shows a long-term picture of the yield difference between the standard 10-year T-Note and the 10-year TIPS (Treasury Inflation Protected Security). We refer to this yield spread as the "Expected CPI", because its value is effectively the CPI that the market expects the government to report over the years ahead. The value of the Expected CPI at any time doesn't tell us much, but the Expected CPI's trend and the change in its value over time give us useful clues about the market's inflation expectations.
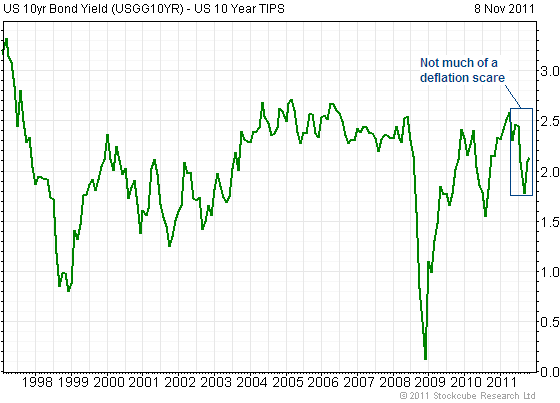
There has been no deflation in the US over the past 15 years. There has, however, been the occasional deflation scare, which we define as a period characterised by sharply rising fear of deflation (indicated on the above chart by a large decline) in parallel with robust monetary inflation. The biggest deflation scares happened in 1998, 2001-2002, and 2008. There was also a deflation scare during May-October of this year, although it was a relatively minor one.
Deflation scares are always associated with downward trends in the stock market. This doesn't mean that a future substantial stock market decline will necessarily be linked to a deflation scare, but it does mean that a deflation scare won't happen unless there is a substantial decline in the stock market. Therefore, if our stock market outlook is in the right ballpark then by the second half of next year the conditions will be in place for a deflation scare worthy of the name. This is something to bear in mind, but our goal is to base our investing and speculating decisions on real-time evidence.
The Stock Market
Big downside risk to earnings forecasts
"Within the S&P 500, there have so far been 65 negative fourth-quarter earnings preannouncements, against 19 positives, according to data provided by Thomson Reuters, for a negative-to-positive ratio of 3.4.
That's the highest seen since the 3.7 ratio in the second quarter of 2001, which was soon after the start of a recession.
The S&P 500's year-over-year fourth-quarter earnings growth estimate is now 10.8%, down from 15% on Oct. 3.
In other words, even as the market has rallied, the outlook for earnings has gotten worse."
- From a WSJ blog entry on 4th November
The above indicates that the earnings forecasts of companies and the analysts who follow them have begun to slide. The risk is that if the US recession and global economic slowdown extends well into next year then current forecasts are still near the top of a long and steep slide.
If your assessment of stock market risk is based on recent earnings, coincident economic indicators and the wildly optimistic assumption that there will be significant growth in corporate earnings over the next 12 months, then you will probably perceive minimal risk at this time and consider the average valuation to be reasonable. However, if you focus on leading indicators then you probably won't be so sanguine about the stock market's prospects.
The problem for the bulls is that a reliable group of leading indicators
points to recession, which, in turn, points to next year's corporate earnings being a lot lower than this year's. Unless this group of leading indicators is giving a false recession signal for the first time ever, the senior stock indices are probably going to be a lot lower at this time next year than they are today.
Current Market Situation
Fear associated with the euro-zone's sovereign debt crisis moved up a notch on Wednesday. A knock-on effect was a sharp decline in the S&P500 Index.
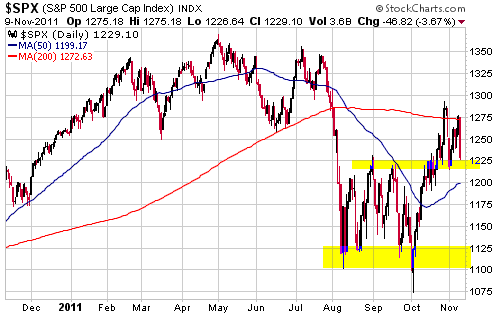
Wednesday's decline didn't significantly alter the 'technical picture'. As illustrated by the following daily chart, the S&P500 has short-term support from 1225 down to 1216 (the 1st November intra-day low). It would take a daily close below 1216 to turn the chart pattern negative.
If the S&P500's chart turns negative within the next few days then we could get a re-test of intermediate-term support in the low-1100s before year-end. However, given the sentiment backdrop there is very little chance of this support being breached within the next three months.
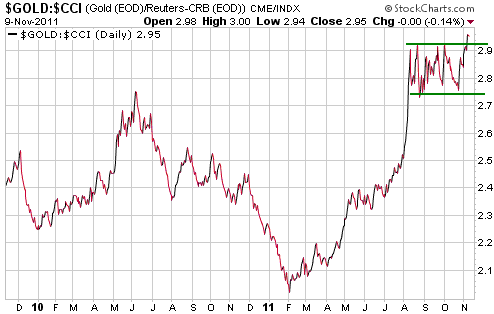
Most of the indicators we track suggest that the 4th October stock market low will not be breached for at least three months and possibly for more than six months. However, the gold/CCI ratio (gold relative to commodities in general) continues to be an important holdout.
From early August through to the beginning of this week, gold/CCI oscillated within a narrow horizontal range. To confirm the 4th October stock market low and a multi-month trend shift towards riskier assets, the eventual breakout from this horizontal range should have been to the downside. However, as if in a deliberate attempt to keep the waters as muddy as possible the ratio broke out to the upside early this week. See the following chart for details.
This week's upside breakout in gold/CCI didn't just create a new 52-week high; it also created a new all-time high. We don't know how this should be interpreted, other than as a warning to remain defensive.
Gold and the Dollar
Gold and Silver
In the latest Weekly Update we mentioned the minor bearish non-confirmation between gold and silver that had recently occurred. We are referring to gold's break above its late-October high not being matched by a similar break in silver.
This week's price action has magnified the non-confirmation in that gold moved further above its late-October high during the first two days of the week while silver remained below its equivalent level. Both markets then reversed downward on Wednesday.
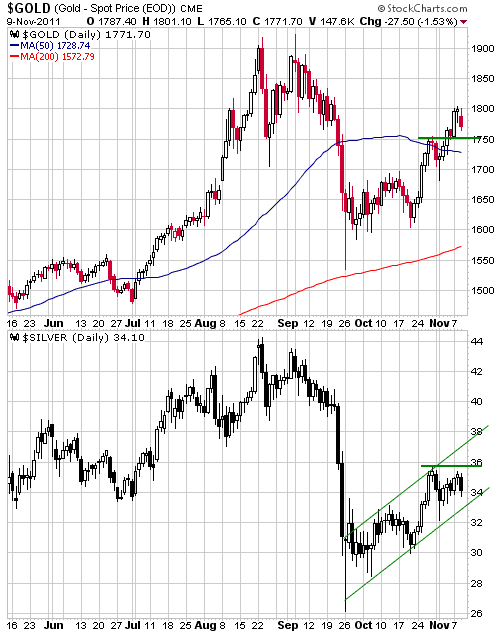
Silver could eliminate the bearish non-confirmation by closing above $36.00. Alternatively, a daily close below $32.50 would point to a decline to $30.
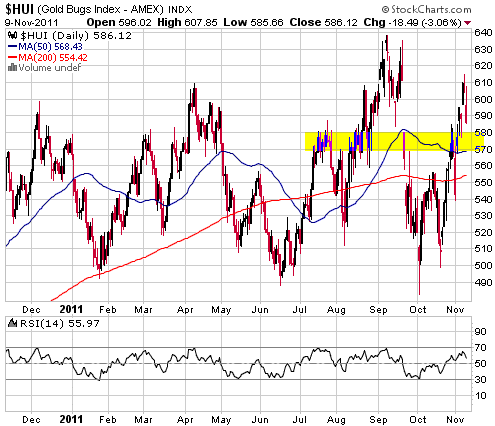
Gold Stocks
As long as it ends up doing no worse than taking the HUI back to the support that extends from 580 down to the high-560s, it will be appropriate to describe the pullback that began earlier this week as a "healthy correction" or "pause that refreshes". The reason is that this pullback, provided that it doesn't result in a breach of support, will prevent the HUI from becoming prematurely 'overbought' and thus help to extend the upward trend.
Our view continues to be that the overall upward trend will continue into December, but that the upside potential is limited by the September peak (640).
If tax loss selling is going to have a significant effect on the gold and silver juniors this year, the next 6 weeks is when the effect will be most noticeable. Keep this in mind if you are looking for opportunities to buy beaten-down junior mining stocks that trade in Canada or the US.
Currency Market Update
Some analysts have argued that Greece's economy is so small that the Greek government's financial problems are almost irrelevant. This argument is valid as far as it goes, but the fear that is engulfing the financial world has little to do with a default by Greece's government. The credit market has, after all, been discounting a Greek government bond default for months.
The fear is that a failure to 'stop the rot' at Greece will lead to default by the governments of much larger euro-zone economies, most importantly the government of Italy. The euro-zone's leaders might be able to come up with a scheme that fills the holes in bank balance sheets caused by a Greek government debt default, but in the absence of massive ECB debt monetisation -- which is something Germany's leadership is totally against at this time -- they could not possibly come up with a scheme that covered up the losses stemming from an Italian government debt default.
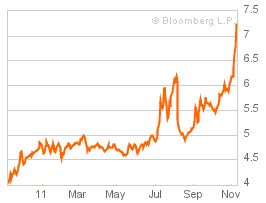
The recent surge in Italian bond yields illustrated by the following Bloomberg chart therefore constitutes a really big problem for Europe's central planners. The markets are simply not cooperating, which is a central planner's worst nightmare.
Government debt default isn't inherently bearish for the associated currency. At least, it isn't bearish in the intermediate-term or the long-term. It only becomes bearish if the central bank tries to stave-off a direct default by creating lots of new money.
In the short-term, debt default can be bearish for two reasons. First, short-term market moves often have a lot more to do with changes in sentiment than with fundamental developments. Second, the possibility of government debt default creates uncertainty. Who knows how the policy-makers will react to the increasing risk of default? With their 'backs to the wall', they would be capable of almost anything. In particular, they would be capable of doing something unimaginably stupid.
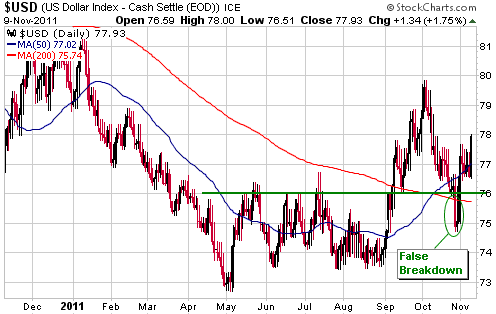
Increasing uncertainty related to the euro-zone's mushrooming sovereign debt crisis COULD lead to a large decline in the euro and a large rise in the Dollar Index. We emphasised the word "could" in the preceding sentence because a large euro decline is definitely not guaranteed.
As far as the next few weeks are concerned, what is all but guaranteed is volatility.
Update
on Stock Selections
Notes: 1) To review the complete list of current TSI stock selections, logon at
http://www.speculative-investor.com/new/market_logon.asp
and then click on "Stock Selections" in the menu. When at the Stock
Selections page, click on a stock's symbol to bring-up an archive of
our comments on the stock in question. 2) The Small Stock Watch List is
located at http://www.speculative-investor.com/new/smallstockwatch.html
 Evolution Mining (ASX: EVN) (Formerly Catalpa Resource, CAH). Shares: 693M issued, 709M fully diluted (including the 105M new shares that will be issued under the rights offer announced this week). Recent price: A$1.72 Evolution Mining (ASX: EVN) (Formerly Catalpa Resource, CAH). Shares: 693M issued, 709M fully diluted (including the 105M new shares that will be issued under the rights offer announced this week). Recent price: A$1.72
EVN was halted on 9th November and will resume trading on 14th November. It has been halted to allow the institutional component of a $150M rights offer to be 'put to bed'.
The above-mentioned rights offer is the final part of the deal transforming Catalpa Resource into Evolution Mining. Under this offer, existing shareholders are being given rights to purchase 3 additional EVN shares at a price of A$1.45 for every 17 shares they own. The rights of any shareholder who does not take up the offer will be sold and the proceeds of the sale sent to the shareholder. This applies to shareholders with addresses outside Australia and New Zealand, as they won't be eligible to exercise the rights.
If you want to increase your position in EVN it shouldn't make a significant difference whether you exercise your rights or allow your rights to be sold and purchase the same amount of shares on the market.
Our opinion is that EVN is a reasonable candidate for new buying near its current price (A$1.71) and would be a strong buy if it dropped back to the low-A$1.50s.
Endeavour Mining (TSX: EDV). Shares: 254M (including new shares to be issued due to the impending merger with Adamus). Recent price: C$2.35
EDV moved quickly up to chart resistance on Monday of this week. The sudden emergence of strength was possibly due to anticipation of the good quarterly financial results that were announced on Tuesday. There was more news on Wednesday, with the company announcing that it had agreed to sell its Advisory Business for staged payments totaling $20M.
The sale of the Advisory Business is neutral at best from a financial perspective, but it does mean that the company is now almost 100% focused on its gold mining operations in West Africa. These operations will have current production of 185K ounces/year once the merger with Adamus Resources (ASX: ADU) is complete, and are expected to have production of 250K ounces/year by the end of 2013 due to development of an existing Feasibility-Stage project.
Due to its relatively low post-merger cash cost of around $600/oz, EDV should generate a lot of cash over the next 12 months if the gold price averages at least $1500/oz (which it almost certainly will). The stock's relatively low valuation suggests that this cash flow generation is not factored into the current stock price, and, therefore, that the stock has a lot of upside potential. At the same time, downside risk is mitigated by the company's strong balance sheet.
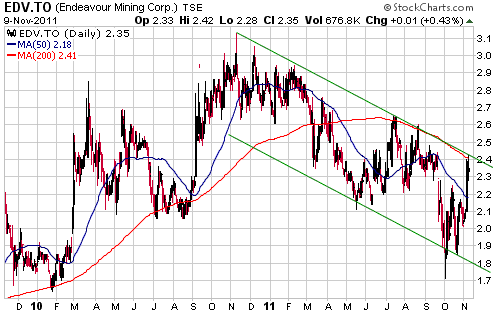
In the TSI Stocks List there is exposure to EDV via the February-2014 C$2.50 warrants (TSX: EDV.WT.A). We think that the stock and the warrants are good candidates for new buying near their current prices in the low-C$2.30s and the low-C$0.60s, respectively. The warrants are a lot riskier than the stock, but have a lot more upside potential.
Chart Sources
Charts appearing in today's commentary
are courtesy of:
http://stockcharts.com/index.html
http://www.fullermoney.com/

|
