![]()
![]()
![]()
![]()
- Interim Update 9th December 2015
Copyright
Reminder
The commentaries that appear at TSI
may not be distributed, in full or in part, without our written permission.
In particular, please note that the posting of extracts from TSI commentaries
at other web sites or providing links to TSI commentaries at other web
sites (for example, at discussion boards) without our written permission
is prohibited.
We reserve the right to immediately
terminate the subscription of any TSI subscriber who distributes the TSI
commentaries without our written permission.
The Stock Market
The US
The decline in house prices that began in 2006 wasn't the cause of the 2007-2009
economic bust. The cause was widespread mal-investment resulting from monetary
inflation and the Fed's interest-rate manipulation. However, the 2006 reversal
in house prices led to a series of falling economic dominoes due to the fact
that the housing market was where a disproportionately large amount of the
mal-investment and associated debt happened to be. The reason for mentioning
this is that the 2014 downward price reversal in the oil market might have
played the same role as the 2006 downward reversal in the housing market,
because this time around a disproportionately large amount of the mal-investment
and associated debt happened to be linked directly or indirectly to the booming
oil industry.
A lot of high-yield debt was linked both directly and indirectly to the booming
US oil industry, which is why proxies for the US high-yield bond market reversed
downward at almost the same time as the oil price in mid-2014. With ETFs such as
JNK (the Barclays High Yield Bond Fund) and HYG (the iShares High Yield Bond
Fund) having made new 3-year lows during the first half of this week there is
little doubt that the US high-yield corporate bond market is immersed in a
cyclical bearish trend. In effect, the falling of the oil domino knocked the
high-yield bond-market domino down.
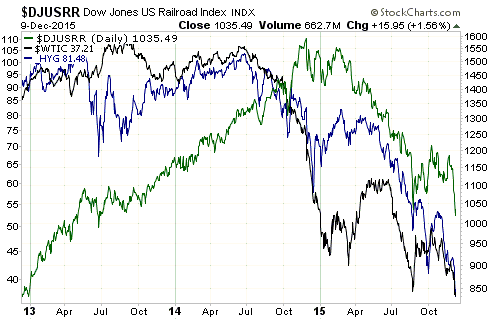
Another of the dominoes to fall in reaction to the oil reversal is the railroad
industry. The railroad business boomed due to a large increase in the demand for
rail cars to carry oil from the oil-fields and supplies to the oil-fields. In
this case the reaction was delayed, as it wasn't until late last year that
investors began to connect the dots. During the first half of this week the Dow
Jones US Railroad Index (DJUSRR) made a new 2-year low and is clearly immersed
in a cyclical bear market.
The following chart provides a visual representation of the falling dominoes
discussed above. Notice that HYG, an ETF proxy for high-yield bonds, reversed
downward almost immediately after the oil price reversed downward, whereas
DJUSRR trended upward for an additional 5 months before toppling over.
There's a high risk that economic dominoes will continue to fall until there are
none left standing, but be warned that it could be a very drawn-out process.
During the preceding cycle there was a 2-year gap from the downward reversal in
the housing market to a general capitulation, and this time around the monetary
backdrop is more bullish.
The Emerging Markets
In the 30th November Weekly Update and again in the 2nd December Interim Update,
we wrote that a bearish EEM (Emerging Markets Equity ETF) speculation could be a
reasonable hedge for investors with exposure to commodity-related equities and
that we had established an EEM put-option position. Our reasoning was that
although the trends for commodities and emerging-market equities are linked, EEM
had become very expensive relative to the average commodity. We are visiting EEM
for the third time in only two weeks to emphasise the point that its price
action suggests significant downside potential.
Relative to the SPX, EEM's bear market looks stretched in terms of both time and
magnitude and surely can't be much more than a few months from its end (although
that's what we thought at this time last year). However, relative to mining
stocks it's a different story.
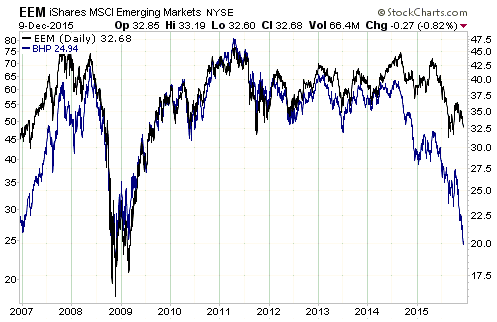
To explain, here is a chart comparing EEM with the stock price of BHP, the
world's largest diversified mining company. Notice how closely the two lines on
the chart tracked each other until the second quarter of last year, at which
point the blue line (BHP) began to fall relative to the black line (EEM). If the
relationship of the preceding 7 years had remained in force, EEM would now be
trading at around $20. Instead, it is trading in the low-$30s.
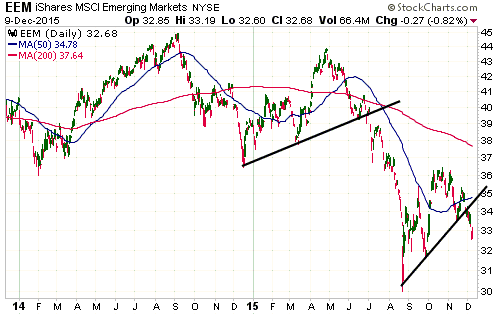
The pre-2014 relationship between EEM and mining stocks suggests the possibility
that EEM will make a catch-up move to the downside over the next few months.
Also, EEM's short-term chart (see below) looks precarious, in that its current
position looks similar to its position in early July.
Gold and the Dollar
Gold
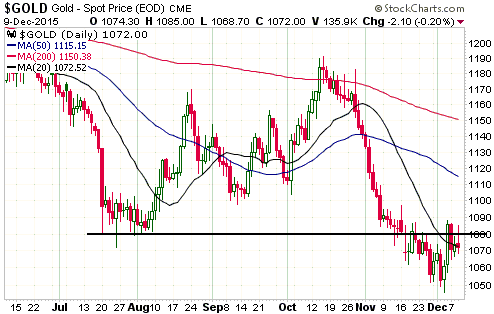
The US$ gold price wasn't able to sustain last Friday's break above $1080.
The main short-term problem for gold is the extreme broad-based weakness in
commodity prices at a time when its true fundamentals are no better than
neutral. However, sentiment is very constructive and the stage remains set for
an upward reversal at around the time of the 16th December FOMC announcement.
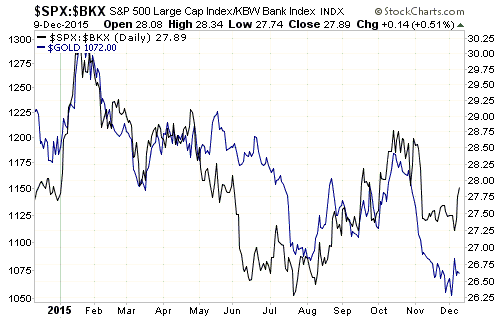
It's worth noting that while the overall fundamental backdrop remains neutral
(at best) for gold, the fundamental driver that exerted the most influence on
gold over the past 12 months has just begun to move in a gold-bullish manner. We
are referring to the relative strength of the banking sector, as indicated on
the following chart by the SPX/BKX ratio. Relative weakness in the BKX (a rising
SPX/BKX ratio) is bullish for gold and relative strength in the BKX (a falling
SPX/BKX ratio) is bearish for gold.
The following chart shows that the early signs over the past week of an upward
reversal in the gold price have been accompanied by early signs of an upward
reversal in the SPX/BKX ratio.
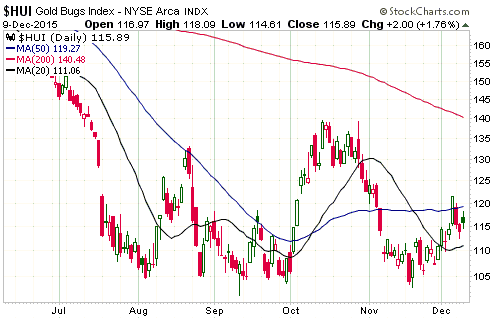
Gold Stocks
Current Market Situation
As we noted in the email sent to subscribers earlier this week, the HUI wasn't
able to confirm an upward reversal in its short-term trend. The ideal price
action would have entailed a gain on Monday (to confirm a trend reversal)
followed by some consolidation in the lead up to next week's FOMC announcement,
but the consolidation began on Monday.
If the consolidation continues for a few more days then the stage will be set
for a post-FOMC rally, regardless of what the Fed announces.
The proof is in the pudding
It is often said that "the proof is in the pudding", which doesn't make sense.
The correct saying, which does make sense, is: "The proof of the pudding is in
the eating". It means that in certain cases the real worth of something can only
be determined by practical experience. This saying applies in a big way to
mineral deposits, in that the proof of a mineral deposit is in the mining.
It is important to understand that estimates of in-ground resources are always
based on assumptions and incomplete data, because only a small percentage of any
mineral deposit will be drilled. To do otherwise, that is, to drill
closely-spaced holes covering the entire deposit, would be prohibitively
expensive. The goal is to drill enough holes to develop a model in which there
is reasonable confidence. The model then fills in the blanks, that is, the model
makes assumptions regarding what's in the ground in the spaces between, under
and outside the drill-holes.
Due to the way they are determined, resource estimates and models are never
totally accurate. Sometimes they understate and at other times they overstate
the amount of valuable mineral that can be recovered, with over-estimation
potentially being a problem and under-estimation eventually becoming a pleasant
surprise. Also, while over-estimation of the mineral resource will generally
result in a deposit being less valuable than originally calculated, it won't
necessarily be a deal-breaker. It depends on the extent and details of the
over-estimation.
Although no resource estimate will be totally accurate, some deposits, by their
nature, lend themselves more readily to being accurately estimated via drilling.
For example, if every time you sink a drill into a deposit you end up
intersecting 80m-150m of 1-g/t gold with the gold evenly dispersed over the
drill core, then it is relatively straightforward to come up with a model that
reflects reality; however, if your drilling results consist of very narrow
intersections of extremely high-grade gold within long widths of unmineralised
material, it will be far more difficult to come up with a model that reflects
reality even if you drill a much larger number of holes.
In any case, it will only be after a mineral deposit starts being mined that you
will find out, for sure, exactly what's below the ground. That's why the first
few months of production is a high-risk/high-reward scenario for the owners of
junior mining stocks. During this period there is a higher-than-usual risk of
something going wrong, but if it turns out that the mining validates the model
then large stock-price gains are a likely outcome.
A couple of years ago there was a huge controversy regarding the resource
estimate for the Brucejack project of Pretium Resources (PVG). One experienced
consultant (Strathcona) stated that the resource model being used by another
experienced consultant (Snowden) and PVG's management was completely wrong.
Since that time the company has spent tens of millions of dollars gathering more
data via bulk testing and additional drilling. All of the new data have been
consistent with the Snowden/PVG resource model, but even so it won't be known
for certain that the resource model is correct until after mining commences.
There's now a smaller controversy, sparked by geologist and newsletter-writer
Brent Cook, regarding the resource estimate for one of the deposits being
developed by Asanko Gold (AKG). As is the case with PVG, it won't be known
whether AKG's resource model is correct or not until after the start of
production. The difference is that AKG is due to commence production next month,
whereas PVG isn't scheduled to commence production until 2017. In other words,
the proof of the AKG resource estimate will happen much sooner.
The Currency Market
The Dollar Index has important support at 96-97 and the euro has important
resistance at 110-111. These levels are now being tested as speculative
positions are unwound ahead of next week's FOMC meeting.
Today we are going to highlight the relationship between the Canadian Dollar
(C$) and the US$ oil price. Most of our readers are probably aware that the C$
is influenced by what's happening to the oil price, but many of our readers
probably aren't aware of how closely the C$ has tracked the oil price over the
past two years.
As illustrated below, over the past two years almost every twist/turn in the oil
price (the black line) has been accompanied by an equivalent twist/turn in the
C$ (the green line). Not surprisingly, therefore, this week's plunge in the oil
price to a new bear-market low went hand-in-hand with a plunge in the C$ to a
new bear-market low.
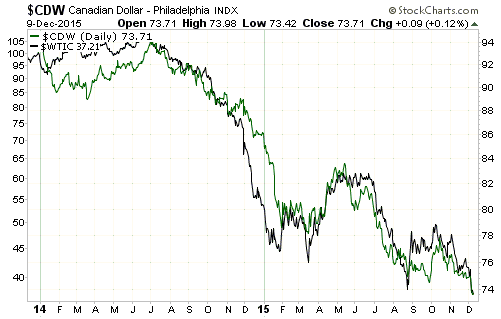
It is apparent that the C$ will remain in a bear market for as long as oil
remains in a bear market, although there could be a divergence/non-confirmation
near the ultimate bottom with oil making a new low while the C$ makes a higher
low.
Our opinion is that both the C$ and the oil bear markets are stretched on an
intermediate-term basis and that even if these bear markets are destined to
continue for another 2+ years they are likely to be interrupted by
intermediate-term rallies beginning within the coming 2 months.
Updates on Stock Selections
Notes: 1) To review the complete list of current TSI stock selections, logon at
http://www.speculative-investor.com/new/market_logon.asp
and then click on "Stock Selections" in the menu. When at the Stock
Selections page, click on a stock's symbol to bring-up an archive of
our comments on the stock in question. 2) The Small Stock Watch List is
located at http://www.speculative-investor.com/new/smallstockwatch.html
![]() More
comments on the Asanko Gold (AKG) uncertainty
More
comments on the Asanko Gold (AKG) uncertainty
The AKG stock price dropped a lot further than the gold-mining indices and ETFs
on Monday 7th December. This could have been related to the resource
overstatement risk that we mentioned in the latest Weekly Update, but there are
other possible explanations. For example, even though it doesn't need the money,
it is not out of the question that AKG will do an equity financing in the near
future. For another example, word might have leaked out or a false rumour might
have been spread that AKG is preparing to make a takeover bid for another junior
miner, with Roxgold (ROG.V) being the likely recipient of the bid. We haven't
heard any such rumour, but we noticed a strange surge in the ROG stock price on
8th December. A third possibility is that someone wanted or needed to sell a
sizable quantity of shares for reasons that have nothing to do with AKG's
prospects. In any case, AKG fully recouped its Monday loss on Tuesday and
Wednesday.
As mentioned in the "Proof is in the pudding" discussion above, we won't know
whether or not concerns about AKG's resource estimate are valid until sometime
after it goes into production. Nobody will. That being said, the company has
been doing grade-control drilling with the aim of reconciling mined material
with the resource model. If there is a significant deviation between the grades
being encountered by the grade-control drilling and the grades predicted by the
resource model, the company should issue a press release explaining the expected
effects of this deviation.
In the absence of additional information from the company, there is not much
more that we can say on this matter. The perceived risk has increased, but it
isn't known that there is a problem.
Chart Sources
Charts appearing in today's commentary
are courtesy of:
http://stockcharts.com/index.html
![]()