![]()
![]()
![]()
![]()
- Interim Update 10th May 2017
Copyright
Reminder
The commentaries that appear at TSI
may not be distributed, in full or in part, without our written permission.
In particular, please note that the posting of extracts from TSI commentaries
at other web sites or providing links to TSI commentaries at other web
sites (for example, at discussion boards) without our written permission
is prohibited.
We reserve the right to immediately
terminate the subscription of any TSI subscriber who distributes the TSI
commentaries without our written permission.
What is a bull market?
A reasonable definition of a
bull market must be practical. This means that it must take into account
the fact that what people really want from an investment is an increase in
purchasing power, not just an increase in price. Figuring out whether or
not an investment is in a bull market is therefore not as straightforward
as observing its long-term trend in nominal currency terms.
Here's
a great example of why looking only at nominal price change doesn't
necessarily indicate whether or not something is in a bull market: Ten
years ago, the price of everything in the world was in a powerful upward
trend when price was expressed in terms of the Zimbabwe dollar. Obviously,
it was far more reasonable in this case to say that the Zimbabwe dollar
was in a bear market than to say that everything else was in a bull
market.
The Zimbabwe example is extreme, but the fact is that all
of today's official currencies are losing purchasing power (PP). They are
losing PP at different rates and some are losing PP quite slowly at the
present time, but not one of them is likely to be a good measuring stick
over a long period.
Unfortunately, determining whether or not an
investment is gaining value in real terms is problematic due to the
impossibility of coming up with a single number that reflects the
economy-wide PP of money. We have a method of adjusting for the effects of
monetary inflation that should be 'in the right ballpark' over periods of
more than 5 years, but our method could be wildly inaccurate over periods
of less than 2 years. Inflation-adjusting using the official CPI, on the
other hand, is likely to be inaccurate over all periods and wildly
inaccurate over the long-term.
In a world where the official
currencies make poor measuring sticks due to their relentless and variable
depreciation, looking at the relative performances of different
investments is probably the best way to determine which ones are in bull
markets. Furthermore, because they are effectively at opposite ends of an
investment seesaw, with one doing best when confidence in money, central
banking and government is rising and the other doing best when confidence
in money, central banking and government is falling, this is a concept
that works especially well for gold bullion and the S&P500 Index (SPX).
There will be times when both gold and the SPX are rising in US$
terms, but it will always be possible to tell the one that is in a genuine
bull market because it will be the one that is the stronger. More
specifically, if the SPX/gold ratio is in a multi-year upward trend then
the SPX is in a bull market and gold is not, whereas if the SPX/gold ratio
is in a multi-year downward trend then gold is in a bull market and the
SPX is not. There will naturally be periods of a year or longer when it
will be impossible to determine whether a multi-year trend has reversed or
is consolidating (we are now in the midst of such a period), but, as
discussed last week, there is a moving-average crossover that can be used
to confirm a reversal in timely fashion.
In conclusion, it is
reasonable to say that an investment is in a bull market if it is in a
multi-year upward trend in nominal currency terms AND relative to its main
competition.
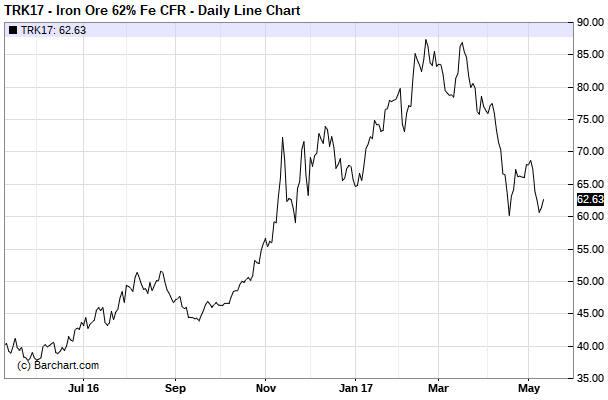
Iron-Ore
In the world of industrial
commodities, the iron-ore market led the way higher from a January-2016
low and then confirmed an intermediate-term downward reversal when it
broke below $80/tonne in March of this year.
Due to its leadership,
over the past year we have paid more attention to iron-ore than we
normally would. We will continue to do so, because at some point over the
next few months it could provide timely confirmation of an
intermediate-term reversal to the upside.
As illustrated below, the
iron-ore price has found some support near $60. However, it would need to
get back above $75 on a weekly closing basis to suggest that the bottom
was in.
The Stock Market
The following daily chart shows
the SPX and the Volatility Index (VIX).
During the second half of
April the SPX quickly rose from near a 2-month low to near its 1st March
all-time high. It has since hovered near its all-time high, not showing
any signs of weakness but also not managing to break out to the upside.
This lack of volatility with the price near an all-time high has pushed
the VIX down to a 20-year low.
With the VIX at such a low level it is tempting to buy VIX call
options. At least, it would be if the options weren't so expensive.
VIX call options with a few months to expiry often seem expensive
because they are based on VIX futures prices rather than on the index
itself. For example, even though the VIX ended the 10th May session at
only 10.2, the October-2017 VIX futures contract ended the same session at
15.6. Consequently, if you were to buy October-2017 VIX calls right now
you would be buying calls that are priced on the basis of an underlying
index value of 15.6.
The large premium to the spot index at which
VIX futures contracts usually trade is the reason you will lose money
buying a volatility ETF/ETN such as VXX unless you get the timing exactly
right. These ETFs/ETNs are regularly rolling from relatively low-priced
nearer-dated contracts into relatively high-priced later-dated contracts,
leaking value as they go.
The stock market is currently a high-risk
proposition, but it is not going to 'fall out of bed' with no warning.
Ideally, a warning will come in the form of a failed upside breakout (a
surge into new-high territory that is quickly reversed), as this would
create a relatively low-risk setup for a bearish speculation.
Alternatively, any decline that takes out the SPX's March low would be a
clear-cut warning.
Gold and the Dollar
Gold
Based on the daily RSI(14), on Tuesday of this week the gold market became
short-term 'oversold' for the first time this year. However, while there
is some support in the $1215-$1220 range, the price could still drop to
lateral support in the $1190s before a 1-3 week counter-trend rebound gets
underway.
Assuming that an interim low is either already in place
or will soon be put in place via a spike down to the $1190s, the
$1245-$1255 range is a likely place for a rebound peak.
Silver
The silver extreme became even more so
over the first two days of this week. In particular, by the close of
trading on Tuesday 9th May silver's daily RSI(14) was near a 20-year low
of only 17.4 and the price had fallen on 15 of the latest 16 trading days.
The relentlessness of the decline was made possible by the price
having reversed course after speculators had built up a record-high
net-long position in silver futures. We will therefore be more interested
than usual to see the COT data at the end of this week. The data will show
the positioning at the close of Tuesday's trading session and will
therefore reveal the extent to which speculators in the futures market
liquidated their collective long exposure in response to the price
weakness.
Based on what happened in the past following similar short-term
momentum extremes (as indicated by the daily RSI), this week's low will
NOT be the final low but it will hold for a few weeks. Here's the sequence
that we can reasonably expect:
1) A rebound from this week's low
that lasts about 2 weeks and reaches the 20-day MA (the black line on the
above chart) or a little higher. The rebound target range noted in the
latest Weekly Update ($17.00-$17.50) is still applicable.
2) A
decline that takes the price either slightly below the May low or well
below the May low. Whether it's slightly below or well below will mostly
be determined by the extent to which the speculative net-long position has
been reduced and what's happening in the gold market at the time the May
low is breached.
3) A tradable multi-month rally.
Gold Stocks
The HUI successfully tested support at 180
last week and is now rebounding. The 50-day MA near 196 or a few points
higher is the most likely area for a rebound peak, although a
counter-trend rebound could possibly go as high as the 200-day MA near
210.
We expect that this rebound will be followed by a decline to
new lows for the year, with the likely time-window for an
intermediate-term bottom having narrowed from May-July to June-July due to
the absence of a capitulation over the past week.
Due to the liquidity problems recently experienced by GDXJ and the
resulting decision of the ETF's manager to shift the fund's focus towards
mid-tier gold-mining companies, from now on we will use the Global X Gold
Explorers ETF (GOEX) as our main proxy for the junior end of the
gold-mining sector.
Even though GOEX broke below support defined by
its March low last week, it is likely that a multi-week low is in place. A
rebound to near the 50-day MA ($23) would be normal.
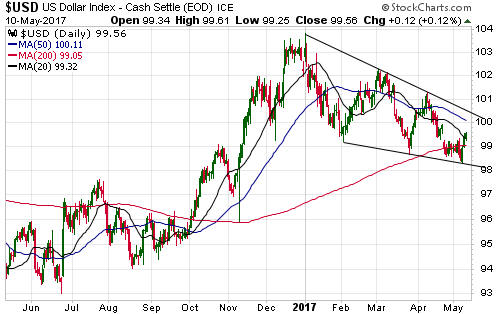
The Currency Market
The Dollar Index
Macron predictably won the French
Presidency on Sunday 7th May and the market reaction was minor. This
supposedly euro-bullish political outcome resulted in only a small upward
spike in the euro and downward spike in the Dollar Index on Monday, no
doubt because the polls had all but ruled out any other outcome well
before 7th May. However, it did cause both the euro and the Dollar Index
to make marginal new extremes for the year before reversals occurred.
This week's reversal increases the probability that May-2017 will be
the fourth in a series of important May lows for the Dollar Index (the
Dollar Index made a multi-month or multi-quarter low in May-2014, May-2015
and May-2016).
Needless to say, Monday's intra-day low is now a
very significant support level. Going the other way, there is trend-line
resistance slightly above 100 and more important resistance defined by the
April high at 101.3. It would take a daily close above 101.3 to remove
most of the remaining doubt that a multi-month low is in place.
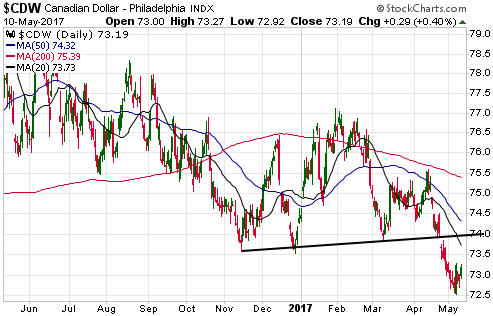
The Canadian Dollar (C$)
A
reversal over the past few days has signaled an interim low and the start
of what will probably turn out to be a 2-3 week rebound for the C$. A
routine rebound would take the C$ up to around 74 to test its previous
downside breakout, after which the longer-term decline would resume.
As noted in an earlier commentary, the short-term technical objective
is 71.
Updates on Stock Selections
Notes: 1) To review the complete list of current TSI stock selections, logon at
http://www.speculative-investor.com/new/market_logon.asp
and then click on "Stock Selections" in the menu. When at the Stock
Selections page, click on a stock's symbol to bring-up an archive of
our comments on the stock in question. 2) The Small Stock Watch List is
located at http://www.speculative-investor.com/new/smallstockwatch.html
Chart Sources
Charts appearing in today's commentary
are courtesy of:
http://stockcharts.com/index.html
http://www.barchart.com/
![]()