![]()
![]()
![]()
![]()
- Interim Update 10th June 2020
Copyright
Reminder
The commentaries that appear at TSI
may not be distributed, in full or in part, without our written permission.
In particular, please note that the posting of extracts from TSI commentaries
at other web sites or providing links to TSI commentaries at other web
sites (for example, at discussion boards) without our written permission
is prohibited.
We reserve the right to immediately
terminate the subscription of any TSI subscriber who distributes the TSI
commentaries without our written permission.
FOMC meeting outcome
Never before has the Fed been so
relevant and the FOMC meeting schedule so irrelevant. The reason is that
while the Fed is dominating the financial world with its enormous asset
monetisation and lending programs, the FOMC meeting schedule no longer has
any bearing on the timing of its actions. Instead, almost all of the Fed's
actions are being decided and announced between FOMC meetings.
The
Fed is announcing changes to its economic and financial-market
interventions almost every week. For example, on Monday of this week it
announced the
expansion of its Main Street Lending program. However, the
outcome of this week's FOMC Meeting was nothing except a load of
waffle about supporting the economy.
The Stock Market
Social unrest looks set
to increase in the US
The stock market usually doesn't
react to social unrest, so it isn't surprising that the stock market's
upward trend wasn't derailed by the protests and riots catalysed by the
death of George Floyd. However, we suspect that the recent protests have
less to do with George Floyd and racism than with growing pessimism about
economic prospects. People who feel like they are doing well economically
or feel like they have the opportunity to do well economically generally
don't take to the streets to demand change.
Unfortunately,
President Trump is regularly 'stirring the pot of discontent', sometimes
deliberately but often unwittingly. As an example of the latter, it is
unseemly for the US President to be cheering-on the incredible stock
market rally at a time when more than 20% of the working population is
unemployed. The stock market rally is widening and deepening the chasm
between the 'haves' and the 'have-nots', thus magnifying the perceived
inequality problem. It should be a source of embarrassment, not a source
of pride, given that it is almost totally an artifact of the Fed's money
pumping and helps speculators while doing nothing for the average
wage-earner.
It could be argued that the average wage-earner will
benefit due to the equity holdings in his/her retirement accounts and
pension funds, but this argument doesn't 'hold water' because the stock
market's 2020 gains will prove to be ephemeral. The market probably will
be a lot lower two years from now, if not in nominal dollar terms then in
'real' terms. Only a tiny proportion of the investing public will exit
near this year's highs. The vast majority is in it for the long haul and
therefore will not benefit from this year's Fed-promoted price surge.
Currently, the unemployment problem is being portrayed as only a
temporary issue and the government is showering the populace with money to
smooth the way through a supposedly short-term interruption to the
economic growth trend. If people are protesting en-masse now, what's going
to happen when it becomes apparent that major, long-term damage has been
done to the economy? Moreover, what's going to happen in 2021-2022 when
food and energy prices start to rise the way stock prices have risen over
the past few months?
This is getting ridiculous
Hertz (HTZ), the rental car company, declared Chapter 11 bankruptcy
after the close of trading on 22nd May. The next trading day (26th May)
the stock closed at US$0.55. There subsequently was no change to the
company's dire financial situation, but from 26th May to 8th June the
stock price gained more than 1,000%.
Having seen how well the
stock of a bankrupt company can do, late last week and early this week
bullish speculators dove into Chesapeake Energy (CHK) -- a
heavily-indebted natural gas producer on the verge of bankruptcy. After
closing at US$14 last Thursday, on Monday of this week CHK traded as high
as US$77.50 for a 2-day gain of about 450%. It subsequently fell back to
$16 as the supply from traders who realise that the company's equity is
worth precisely zero overwhelmed the demand from the 'buy anything that
moves' crowd.
It seems that many traders are aggressively buying
the stocks of companies that were hardest hit by the lockdowns, with no
real consideration given to whether or not the companies have a future. In
this crazy environment, one of the most dangerous things to do is to short
the stock of a bankrupt or nearly-bankrupt company.
This is similar
to 1999-2000, when worthless companies could achieve market
capitalisations in the hundreds of millions of dollars simply by having a
web site, and when a company could achieve a big increase in its market
capitalisation simply by announcing a stock split. It will end badly, but
in the meantime short selling will be a very risky business.
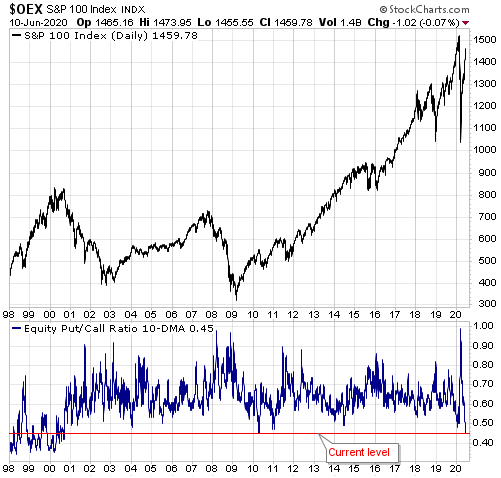
Current Market Situation
While sentiment
indicators remain mixed, there is evidence of a trading mania within the
retail investing world. The evidence includes the eagerness of traders to
'go long' the stocks of bankrupt or nearly-bankrupt companies and the
explosive growth over the past few months in the quantity of trading
accounts at discount brokers. The situation reminds us of the US stock
market during the late stages of the internet bubble (1999-2000) and
China's stock market during the first half of 2015.
The evidence
also includes the aggressive buying of equity call options, which has
pushed the 10-day MA of the equity put/call ratio down to a 19-year low.
Refer to the following chart for more detail.
Over the past 19
years, whenever the 10-day MA of the equity put/call ratio dropped to 0.50
or lower (it is currently 0.45) the stock market was close to at least a
short-term top. Be aware, though, that during 1998-2000 the equity
put/call ratio spent a lot of time below 0.40. Again, refer to the
following chart for more detail. Consequently, if the US stock market has
entered a manic phase then the current low equity put/call level may not
be a useful warning.
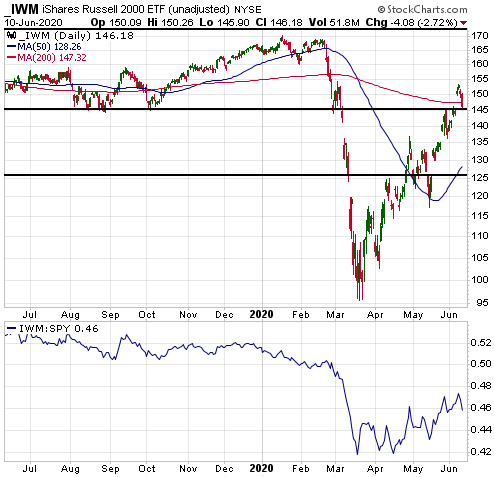
The stock market experienced a modest pullback over the past two
trading days, with the bulk of the weakness focused on the parts of the
market that led to the downside earlier this year and that had been
showing signs of relative strength since mid-May. One example is the
small-cap universe, represented on the following chart by the Russell2000
ETF (IWM). IWM has dropped back to test last week's upside breakout and
would mark the breakout as false (a bearish signal) with a solid weekly
close below US$145.
Another example is the transportation sector, represented on the next
chart by the Dow Transportation Index (TRAN). It looks like TRAN has
reversed lower two days after breaking out to the upside, thus marking the
upside breakout as a false signal. It must end this week below 9600 to
warn that a short-term top is in place.
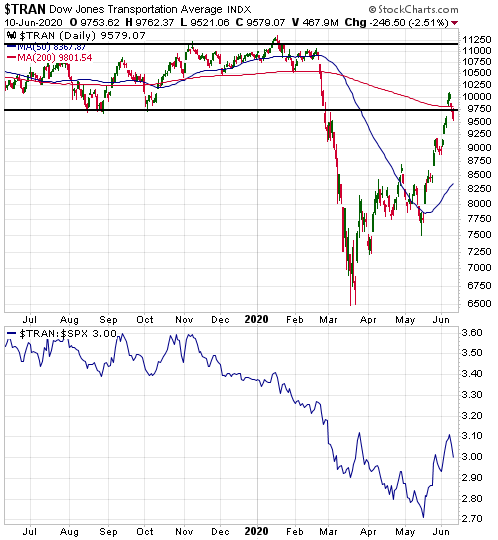
The short-term risk, we think, is a correction that retraces half of
the rally from the March low.
Gold and the Dollar
Gold Bullion and Gold
Mining Stocks
Regarding the gold mining exposure in our
own account, in last week's Interim Update we wrote:
"...we
find ourselves in the position of having no insurance apart from a sizable
cash reserve. This isn't ideal, but it isn't a major concern because a)
the gold mining sector probably won't experience anything more bearish in
the short-term than a routine correction (a decline by the HUI to around
220 would mean that about half the gain from the March low had been
retraced, which would be perfectly normal) and b) the intermediate-term
risk/reward remains bullish."
On the same topic, in the latest
Weekly Update we wrote:
"...if the HUI were to bounce to the
280s during the first half of this week, we would view it as a short-term
selling/hedging opportunity."
The HUI has almost made it back
to the 280s, but we have decided that we won't buy any put-option hedges
at this time. The reasons are:
1) Some evidence has emerged that
the anticipated correction has been cut short and is already complete.
2) Even if the HUI's decline extends to the 220s as originally
expected, based on our longer-term bullish outlook we would be comfortable
riding this out.
3) If the broad stock market enters correction
mode then the herd of novice traders that has been buying anything that
moves could turn its attention to the counter-cyclical gold-mining sector.
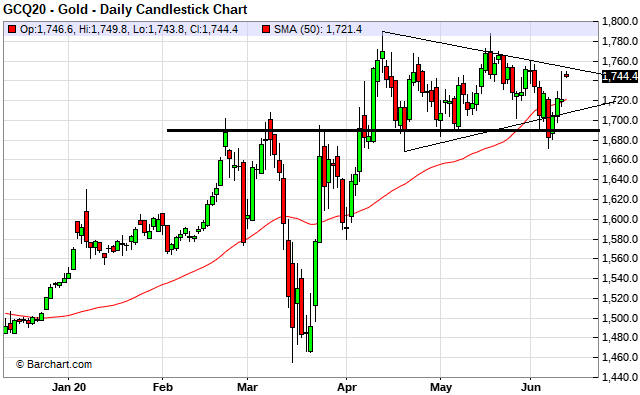
Regarding the evidence that the anticipated correction is already
complete, we are referring to:
1) Gold bullion (basis the
August-2020 futures contract shown on the following daily chart) broke
below its 50-day MA on Wednesday of last week and then ended last week
below important lateral support at $1690. This suggested that a
larger-degree corrective move was in progress, but there was enough
strength over the first three days of this week to negate last week's
bearish price action.
2) The HUI tested support at 260 on five of the past six trading days,
including Wednesday 10th June, without closing below it. The more times a
support/resistance level is tested the more likely it will give way, but
Wednesday's strong rebound from support suggests that the testing process
has been successful.
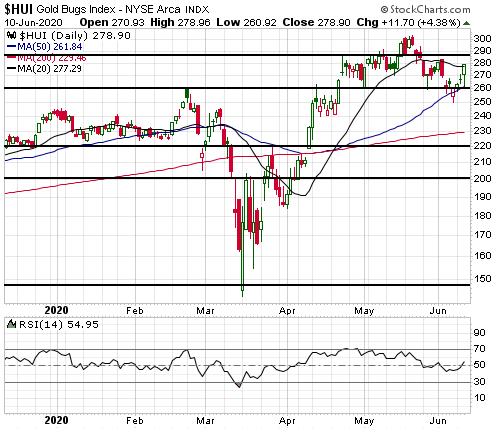
The upshot is that the correction might have been shallower than we
were expecting.
About three weeks ago we described the gold mining
sector's short-term situation as involving both high risk and high
potential reward. There was the risk of a HUI decline to the 220s and the
potential for a surge by the HUI to the mid-300s, with the market action
not clearly pointing one way or the other. The HUI's ability to 'correct'
while holding support and remaining close to its high for the year means
that we now have a similar high-risk/high-reward situation.
The Currency Market
HK$
Devaluation?
Hedge fund manager Kyle Bass has launched a new
fund that is dedicated to an all-or-nothing bet against the Hong Kong
dollar (HK$). According to the article posted
HERE, the fund could see a 64-fold return if the currency drops by 40%
against the US$ within the next 18 months but will lose investors all
their money if Hong Kong's currency is still pegged to the U.S. dollar
after 18 months.
It seems to us that 'investing' in Bass's new fund
is a sure-fire way to lose 100% of your money. For starters, there is the
fact that
Hong Kong's total foreign currency reserve of US$442 billion
represents over six times the local currency in circulation and about 46%
of Hong Kong dollar M3. This implies that the HK government (meaning: the
China government) would have to CHOOSE to devalue. It can't be forced to
devalue by speculators betting against the currency. For seconds (and more
importantly), there is the US Federal Reserve.
We think that the
HKD eventually will be 'unpegged' from the USD and pegged to the Chinese
Yuan at a 1-to-1 rate (1 HKD = 1 Yuan). This could well happen within the
next 18 months, but for such an event to result in a significant decline
in the HKD relative to the USD the Yuan would have to fall by well over
10% relative to the USD (since the Yuan/USD rate presently is about 10%
higher than the HKD/USD rate). A year ago we thought there was a realistic
chance that this amount of Yuan weakness would occur within 2-3 years, but
that's no longer the case. Thanks to the Fed's gargantuan money-pumping
program and unstated, but obvious, plan to monetise massive US government
deficits, the probability of substantial weakness in the Yuan (relative to
the US$) over the next couple of years is now close to zero.
Current Market Situation
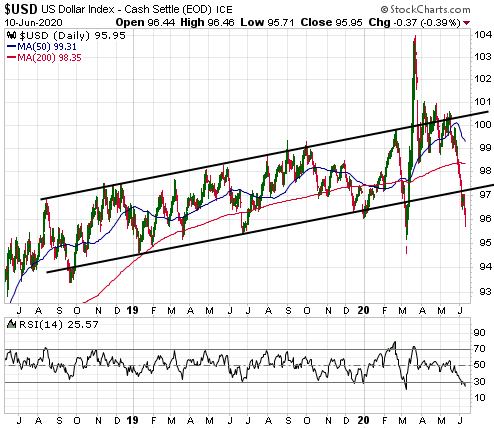
Despite
being short-term 'oversold', the Dollar Index (DX) has continued to slide
and is now down year-to-date. It should commence a countertrend rebound
soon, but as mentioned in the latest Weekly Update we don't have an
opinion as to whether the rebound will be the multi-week variety or just a
multi-day pause-for-breath during an on-going multi-week decline. If it's
the former then a reasonable target for a rebound high would be resistance
near 98.5.
As also mentioned in the latest Weekly Update, we expect
that the fundamentals will shift over the months ahead in a way that
establishes the DX's March-2020 top as the long-term variety (a top that
holds for years).
Updates on Stock Selections
Notes: 1) To review the complete list of current TSI stock selections, logon at
http://www.speculative-investor.com/new/market_logon.asp
and then click on "Stock Selections" in the menu. When at the Stock
Selections page, click on a stock's symbol to bring-up an archive of
our comments on the stock in question. 2) The Small Stock Watch List is
located at http://www.speculative-investor.com/new/smallstockwatch.html
![]() Oil
trades stopped out
Oil
trades stopped out
The Oil Services ETF (OIH) and
Oil-and-Gas ETF (XOP) trading positions in the TSI Stocks List closed
below their trailing stops on Wednesday 10th June and therefore have been
removed from the List. These trades will go into the record books as
sizable losses based on the price levels at which they were first
suggested, but substantial profits could have been achieved based on
subsequent buy suggestions.
We are intermediate-term bullish on the
O&G sector and will look for an opportunity to return one or both of the
above-mentioned ETFs to the List in anticipation of much higher price
levels being reached during the first half of 2021. We expect that such an
opportunity will arrive by October-2020 at the latest.
 Euronav (EURN) Dividend
Just a reminder that EURN
will go 'ex' a US$0.81/share dividend on Monday 15th June. Therefore,
anyone wanting to receive the dividend and who currently isn't a
shareholder will have to buy some shares before the end of this week.
Also, bear in mind that all things remaining equal the stock price will
drop sharply on 15th June to account for the dividend payment.
Chart Sources
Charts appearing in today's commentary
are courtesy of:
https://stockcharts.com/
https://www.barchart.com/
![]()