|
- Interim Update 10th September 2003
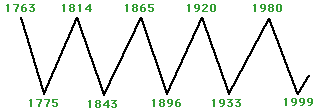
War Cycle
Update
In an article titled "War Cycles and
Peace Cycles" at http://www.speculative-investor.com/new/article050503.html
we drew on the work of Richard Kelly Hoskins to explain why war and peace
cycles occur and how they relate to long-term trends in money-supply growth
and commodity prices. Our conclusion was, and is, that if 1999 gave us
THE bottom in commodity prices (we are confident that it did) then we are
now in the early stages of a long-term war cycle with one of the driving
forces behind this cycle being the need to stimulate money-supply growth.
Importantly, this conclusion is supported by the actions of the US Government
over the past few years on both the foreign and domestic fronts.
Below is a slightly modified version
of the chart that originally appeared in Hoskins' book "War Cycles Peace
Cycles" (we've added the 1999 bottom for the "peace cycle" that began in
1980). As explained in our above-mentioned article, one of the main reasons
for this cyclical behaviour is that "... almost ALL money comes into
existence as the result of a loan. This means that new money must be created
at a fast enough pace to enable existing debts to be paid off, but then
each new dollar borrowed into existence just adds to the problem. At some
point the pool comprising all existing and potential borrowers becomes
unwilling, or unable, to increase its debt burden. When this happens the
money supply stops growing or even begins to contract, making it impossible
for many borrowers to get hold of enough money to pay their debts. The
result is that these borrowers lose a lot of what they worked hard to accumulate
and the social mood, in turn, becomes more conducive to war."
One of the differences between the
current cycle and previous cycles is that during the current cycle the
US Government has been pre-emptive in that it began aggressively
pursuing policies designed to stimulate money-supply growth (deficit spending,
tax cuts, war) while the money supply was still growing at a 'healthy'
pace. With the total level of debt in the US economy at an unprecedented
high it appears as though the US Administration is well aware of the short-term
economic (and therefore political) problems that would be created by a
sustained drop in the money-supply growth rate. As is typically the case,
the desire to get re-elected overrides any longer-term considerations.
This means that 'Band-Aid solutions' - solutions that offer short-term
respite at a cost of long-term pain - are often preferred to long-term
solutions that necessitate short-term pain. Boosting the money-supply growth
rate is one of the oldest-known and most effective Band-Aid solutions used
by governments in their attempts to stay in power.
Note, though, that higher money-supply
growth is only effective as a temporary fix for as long as inflation expectations
remain subdued. Once the money-supply growth is perceived to be having
a big effect on non-financial assets and people begin to anticipate more
currency depreciation relative to non-financial assets, additional money-supply
growth becomes counter-productive (it leads to higher interest rates and
slower economic growth).
Now to our main point: There will be
periods of up to one year when a drop in the money-supply growth rate will
be 'acceptable' as far as the incumbents are concerned, but the period
between now and the November-2004 Presidential election is not going to
be one of them. At the same time, the sharp downturn in the bond market
that began in June indicates that the money-supply growth rate has either
already peaked or will peak within the next few weeks (refer to last week's
Interim Update for an explanation of why this is so). Therefore, an epic
battle between the US Government and natural economic forces is going to
occur over the next year. President Bush's recent request for an additional
$87B to finance the on-going efforts in Iraq and Afghanistan over the next
12 months can be considered to be one of the first shots fired by the Government
in this battle. What Mr Bush has effectively just requested/demanded
is $87B of additional money-supply growth.
As an aside, it is interesting to note
that the US Government is presently the only government of a first-world
country with the option of initiating war as a means of stimulating
money-supply growth. Other countries might be presented with the option
of following the US into a war, but they don't have the power to
start
a war.
The US
Stock Market
Current Market Situation
From the latest Weekly Market Update:
"...we
consider the most likely scenario to be a sharp pullback over the next
few weeks followed by a rally to a new recovery high late in the year before
a major decline gets underway. The next most likely outcome is that the
market continues higher from its current levels and makes a major top during
the next few weeks.
Below is a 1-year chart of the S&P500
Index. There is short-term support at around 1010 and if our preferred
scenario is correct then the S&P500 will close below this support during
the coming week and begin working its way down to intermediate-term support
in the 900-950 range. However, if 1010 holds on a daily closing basis over
the coming week then the alternative scenario mentioned above will become
the most likely scenario."
The S&P500 Index closed at 1011
on Wednesday, so any significant weakness over the remainder of this week
will provide us with some evidence that our preferred scenario (a sharp
pullback over the next few weeks) is going to play out.
While the next pullback will potentially
be gut-wrenching for the bulls, we expect that it will be followed by a
rally to a new recovery high late this year before a major decline (a decline
to below last October's lows) gets underway. One of the main reasons for
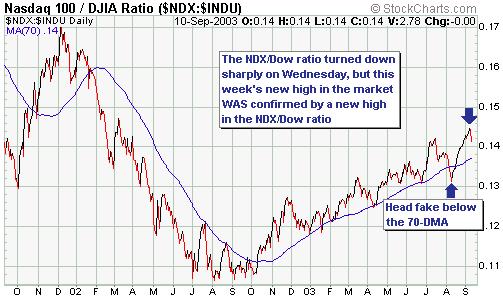
this view is that the recent highs in the senior stock indices were confirmed
by new highs in the NDX/Dow ratio (see chart below). As long as the riskier
NASDAQ100 stocks are trending higher relative to the more staid Dow stocks
there is little chance of a major decline. Furthermore, it is probable
that the NDX/Dow ratio will peak at least a few weeks ahead of a peak in
the Dow Industrials Index because market participants are likely to gravitate
towards the stocks that are perceived to offer greater safety before they
begin to exit the market altogether.
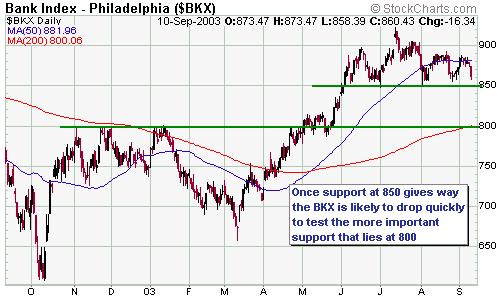
As mentioned above, the S&P500
is currently poised right at support. As the following chart shows, the
Bank Index (BKX) is also very close to support. The BKX has been relatively
weak since the bond market peaked in June and should confirm any break
below support in the S&P500 Index by closing below 850.
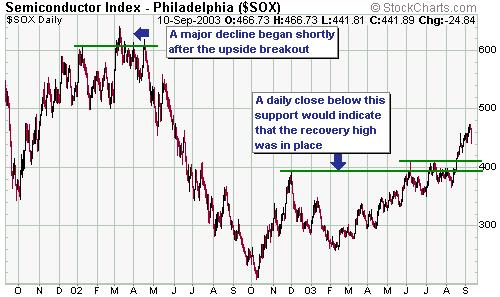
The sector of the market in which there
is the greatest bearish mismatch between price and underlying business
value is probably the semiconductor sector. As such, we use the Semiconductor
Index (SOX) as an indicator of the willingness of market participants to
ignore value in their pursuit of short-term price performance.
The SOX hit a new recovery high early
this week before reversing sharply lower on Wednesday (see chart below).
A normal pullback would see the SOX drop back to around 410 before resuming
its upward march while a daily close below 390 would suggest that an important
peak was already in place.
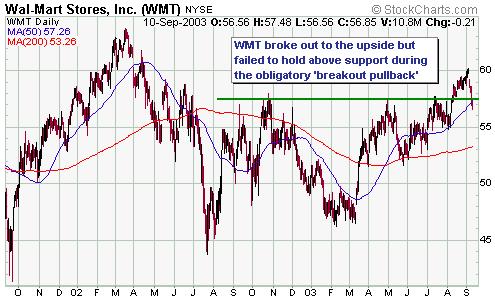
Over the past 12 months the Walmart
stock price has made important peaks and troughs about 1-2 months prior
to important peaks and troughs in the S&P500 Index. As such, we expect
that the ultimate recovery high in WMT will occur several weeks prior to
the ultimate recovery high in the S&P500 Index. Last week's new recovery
high in WMT therefore suggests that a peak in the overall market won't
occur until at least October. Note from the below chart, though, that WMT
has been very weak over the past few days and has dropped below support
(its prior breakout level). This, in turn, is probably a warning that a
sharp correction in the overall market is about to occur.
In summary, there are presently a few
preliminary signs that a sharp pullback in the market is about to unfold
over the coming weeks, but nothing definitive as yet. However, the market
action over the next 2 days should tell us whether or not our preferred
scenario is playing out. If a correction is confirmed then we would expect
the S&P500 Index to drop to at least 950, and probably to as low as
900, before the end of October.
Gold and
the Dollar
Gold Stocks
Our current views on the gold sector
can be summarised as follows:
a) The probability is low that gold
stocks have already peaked, but a major peak will probably occur within
the next few months.
b) The most likely time for a major
peak in the AMEX Gold BUGS Index (HUI) is 2-4 weeks AFTER the Dow Industrials
Index reaches its ultimate recovery high (almost regardless of what happens
to the gold price). Putting a major peak in place is, however, a PROCESS
that usually extends over a period of a few months.
c) There is not much upside potential
in the stocks of many of the large and mid-sized gold producers because
their current stock prices already discount a much higher gold price. In
other words, the risk/reward for these stocks is mediocre at best. However,
there is still considerable upside potential amongst the juniors.
Based on the above views we have suggested
that gold-stock investors gradually scale-out of the sector over the coming
months. Furthermore, to reflect our assessment that it is time to begin
scaling out we have recently recommended profit-taking in four of the positions
in the TSI Stocks List.
The biggest short-term risk for gold
stocks is the strong possibility of a sharp decline in the overall stock
market over the next several weeks. Our expectation is that a decline in
the overall market that took the S&P500 Index back to around 900 would
drag the HUI down to around 175. We expect that this decline would, in
turn, be followed by a rally in the HUI to a new 7-year high before a major
top would become likely.
It is, of course, possible (although
very unlikely) that we are being overly optimistic when it comes to both
the overall stock market and the gold sector and that major declines
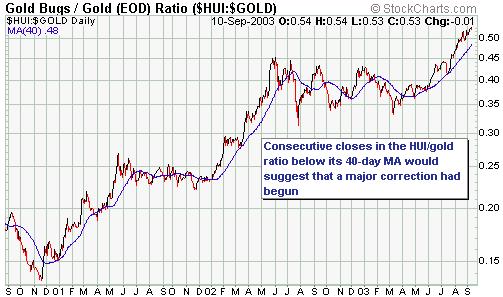
are about to begin. We therefore need to identify an early-warning signal
that this is the case. For such a signal we will use the performance of
the HUI/gold ratio relative to its 40-day moving average.
Below is a chart showing the HUI/gold
ratio and its 40-day moving average. In previous commentaries we've mentioned
the tendency for corrections within intermediate-term up-trends in the
ratio to hold at, or above, the 40-day MA. We will therefore consider two
consecutive daily closes below this moving average to be a signal that
something more ominous than a normal correction is afoot.
Current Market Situation
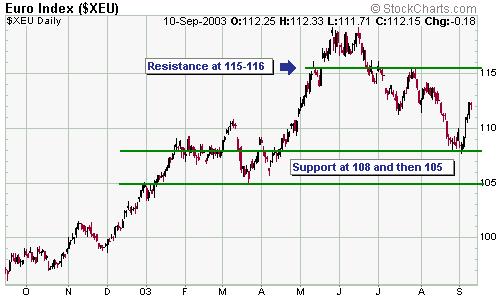
Below is a chart of the euro. It was
almost a certainty that a test of support at 108 would be followed by a
rally to around 111-112, but what happens from here is more difficult to
forecast.
Our expectation is that the euro will
move higher over the next month or so. Also, strength in the gold price
and the aggressive buying of euro futures by commercial traders near the
recent lows suggests that the drop to around 108 created THE correction
low for the euro. However, our level of confidence that the gold price
is going to trade above $400 before the end of this year is considerably
higher than our level of confidence that the euro is going to trade above
its May-2003 peak within the same time-frame.
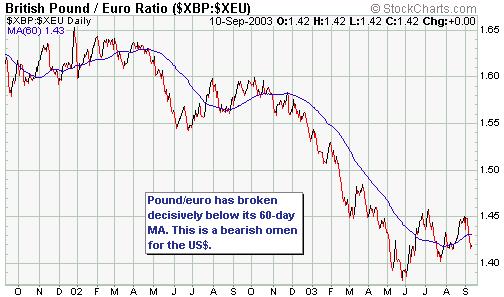
The pound/euro exchange rate has exhibited
a strong tendency to make important reversals a few weeks in advance of
similar reversals in the US$. We therefore use pound/euro as a leading
indicator of the US$.
As the following chart shows, pound/euro
has just broken below its 60-day moving average. This is a bearish omen
for the dollar, although it is possible that pound/euro could spend a few
more months oscillating around this moving average (as it did during the
final quarter of 2001 and the first quarter of 2002) before making a sustainable
move lower. In any case, this is another reason to conclude that the odds
favour a lower US$ over the coming months.
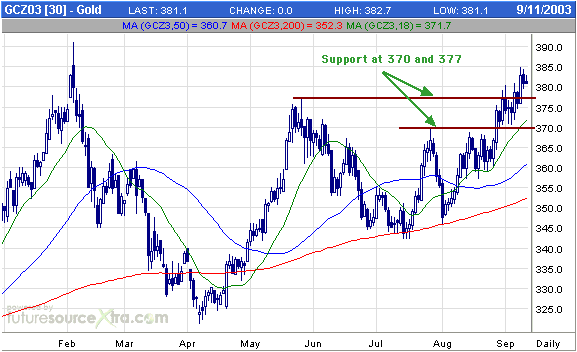
Below is a daily chart of December
gold futures showing the support levels that exist at $377 and $370. Gold
is trading as though it is being accumulated by some very well-financed
individuals or groups, so if there is a near-term pullback (we have no
opinion on whether there will or won't be) then strong buying support is
likely to emerge at, or above, $370. $410 remains our minimum upside
target for gold between now and year-end.
Update
on Stock Selections
 In
the Stock Selection Update e-mail sent to paid-up subscribers on Monday
morning we said we would take profits of around 170% and 150%, respectively,
on the Wheaton River shares and warrants in the Stocks List. We also said
we would add Afrikander Lease (OTC: AFKDY) and Patricia Mining (TSXV: PAT)
to the List. For further details refer to http://www.speculative-investor.com/new/stockemail.asp In
the Stock Selection Update e-mail sent to paid-up subscribers on Monday
morning we said we would take profits of around 170% and 150%, respectively,
on the Wheaton River shares and warrants in the Stocks List. We also said
we would add Afrikander Lease (OTC: AFKDY) and Patricia Mining (TSXV: PAT)
to the List. For further details refer to http://www.speculative-investor.com/new/stockemail.asp
Below
is a table containing all the gold/silver stocks that are presently in
the TSI Stocks List. Next to each stock we've noted our short-term price
target (in those cases where we have a short-term target) and a comment
on whether we think the stock is a buy, hold or sell at the current price.
If you own a stock then you might consider exiting at least part of your
position when the stock approaches our ST price target, although any
decision you make will obviously need to take into account your own financial
situation (including your total exposure to the market). In the TSI commentaries
we provide our assessment of the likely future performances of the markets
and stocks we follow, but you need to decide how to best utilise
the information presented at TSI with respect to your own investments.
In the below table the difference between
a "Speculative Buy" and a "Buy" is that we perceive a greater margin of
safety with a stock that is noted as being a "Buy".
| Symbol |
Stock
Exchange |
Company
Name |
|
Recent
Price $ |
ST
Price Target $ |
Comment |
| BZA |
TSXV |
American Bonanza |
C$ |
0.31 |
0.45-0.50 |
Hold |
| CAU |
AMEX |
Canyon Resources |
US$ |
2.05 |
none |
Hold |
| BDG |
ASX |
Bendigo Gold |
A$ |
0.21 |
0.30 |
Speculative Buy below
0.22 |
| CBD |
TSX |
Cumberland Resources |
C$ |
4.10 |
4.80 |
Hold |
| WTC |
TSX |
Western Silver |
C$ |
5.25 |
none |
Hold |
| RBK |
ASX |
Red Back Mining |
A$ |
0.50 |
0.70 |
Speculative Buy in 0.46-0.50
range |
| DSM |
TSX |
Desert Sun Mining |
C$ |
1.73 |
2.00 |
Hold |
| RIC |
AMEX |
Richmont Mining |
US$ |
4.57 |
none |
Hold |
| RSGO |
ASX |
Resolute Mining Options |
A$ |
0.42 |
0.45-0.50 |
Hold |
| MVG |
TSX |
Metallic Ventures |
C$ |
5.55 |
none |
Hold |
| CDU |
TSXV |
Cardero Resource |
C$ |
1.06 |
2.00 |
Speculative Buy below
1.20 |
| WRM |
TSX |
Wheaton River |
C$ |
2.71 |
2.80-2.90 |
Target achieved. Sell. |
| AQI |
TSXV |
Aquiline Resources |
C$ |
0.87 |
1.50 |
Buy below 0.90 |
| NGX |
TSX |
Northgate Exploration |
C$ |
2.33 |
2.90 |
Hold |
| WRM.WT |
TSX |
Wheaton River Warrants |
C$ |
1.34 |
1.40-1.50 |
Target achieved. Sell. |
| GPXM |
OTCBB |
Golden Phoenix |
US$ |
0.39 |
0.55-0.60 |
Speculative Buy in 0.35-0.39
range |
| CTO |
ASX |
Charters Towers Gold |
A$ |
0.23 |
none |
Buy below 0.20 |
| NRI |
TSX |
NovaGold |
C$ |
5.05 |
6.00 |
Buy below 5.00 |
| MWA |
TSX |
McWatters Mining |
C$ |
0.145 |
0.30-0.35 |
Speculative Buy below
0.16 |
| EMP |
ASX |
Emperor Mines |
A$ |
0.81 |
1.10-1.20 |
Hold |
| METLF |
OTCBB |
Metallica Resources |
US$ |
1.58 |
1.90 |
Buy below 1.50 |
| K.WT |
TSX |
Kinross Gold Warrants |
C$ |
1.35 |
2.50 |
Speculative Buy below
1.35 |
| AFKDY |
OTC |
Afrikander Lease |
US$ |
0.89 |
none |
Buy below 0.90 |
| PAT |
TSXV |
Patricia Mining |
C$ |
0.52 |
0.80 |
Speculative Buy at 0.50
or lower |
| NNO |
TSX |
Northern Orion |
C$ |
1.90 |
none |
Buy below 1.80 |
Chart Sources
Charts appearing in today's commentary
are courtesy of:
http://stockcharts.com/index.html
http://www.futuresource.com/

|
