|
- Interim Update
10th September 2014
Copyright
Reminder
The commentaries that appear at TSI
may not be distributed, in full or in part, without our written permission.
In particular, please note that the posting of extracts from TSI commentaries
at other web sites or providing links to TSI commentaries at other web
sites (for example, at discussion boards) without our written permission
is prohibited.
We reserve the right to immediately
terminate the subscription of any TSI subscriber who distributes the TSI
commentaries without our written permission.
The Stock Market
The US stock market, as represented by the S&P500 Index (SPX),
is not accelerating upward, but it is also not managing to 'correct' in any
meaningful way. It seems that the 'dip buyers' now view any minor decline as a
new buying opportunity.
It has now been almost 22 months since the S&P500 Index last pulled back enough
to touch its 200-day MA. This means that even if the bull market is destined to
extend well into next year, a sizeable correction is way, way overdue.

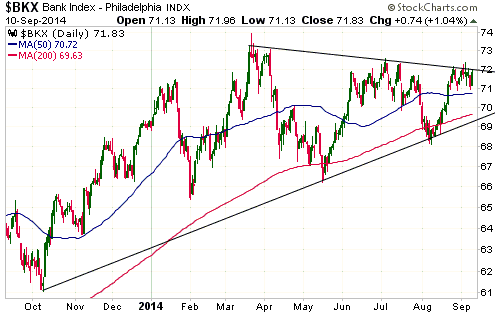
The Bank Index (BKX) is now in an interesting position. It has failed to confirm
any of the new highs made by the SPX since March, but is now very close to a
breach of resistance that would very likely be followed by a move to new highs
for the year. This means that we are about to get either a downward reversal in
BKX and a decline to test the bottom of the contracting range drawn on the
following daily chart, or an upside breakout that brings the BKX into line with
other important US stock indices.

Gold and the Dollar
Gold
Current Market Situation
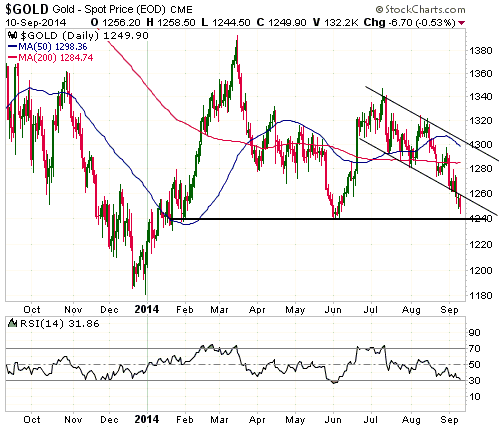
The gold price broke below its short-term channel bottom during the first half
of this week and is now closing-in on important lateral resistance defined by
its June low ($1240).
We have no opinion on whether the above-mentioned support will hold. From our
perspective, the optimum price action over the days ahead would involve a break
below $1240 that was reversed within two days. The reason is that false (quickly
negated) downside breakouts are reliable bullish signals.

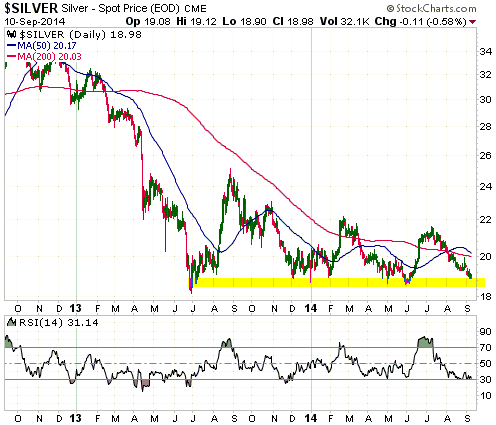
Like the gold market, the silver market is close to important support. However,
whereas the gold market is closing-in on intermediate-term support, the silver
market is now very close to long-term support.

Silver isn't likely to begin its next tradable rally until after gold begins to
rally, and, as noted in a previous commentary, the start of a tradable rally in
gold probably requires the removal of the downward pressure being exerted by the
S&P500's relentless upward trend. To put it another way, the next upward
reversal in the gold market will probably occur within a few days of a downward
reversal in the US stock market.
Retail buying of gold coins is almost always insignificant
A
recent Mineweb article points out that year-to-date sales of US-minted gold
coins have declined almost 54% compared to the same period last year. If they
were consistent, the analysts and commentators who argued that last year's
robust sales of coins to the US public was an important bullish factor would now
be arguing that this year's lacklustre sales figures are a bearish factor. But
that's not what they are doing. Instead, they are looking for other irrelevant
pieces of information to support their bullish views.
In reality, the number of gold coins purchased by the public is never an
important influence on the gold price, one reason being that the quantity of
gold involved is always trivial relative to the size of the market. For example,
the amount of gold minted globally into coins is running at around 3M ounces per
year, which equates to about 10,000 ounces per business day. The amount of gold
traded via the LBMA on an average day is about 2,000-times greater and the
amount of gold covered by futures contracts traded in New York on an average day
is about 7,000-times greater. Even the amount of gold backing the GLD shares
that are traded on an average day is about 70-times greater than the global
daily volume of gold minted into coins.
The bottom line is that when trying to explain what the gold price did in the
past and what it will likely do in the future, it is safe to ignore the quantity
of newly-minted coins sold to the public.
Actually, all transaction volumes can be ignored, whether significant in the
context of the overall market or not. This is because with every transaction
necessarily involving a buyer and a seller, the transaction volume will always
say nothing useful about overall demand. To put it another way, every
transaction involves an increase in demand on the part of the buyer and an
offsetting decrease in demand on the part of the seller. This means that only
the change in price can tell us whether buyers are more or less motivated than
sellers, and, therefore, whether overall demand is rising or falling.
Gold Stocks
Current Market Situation
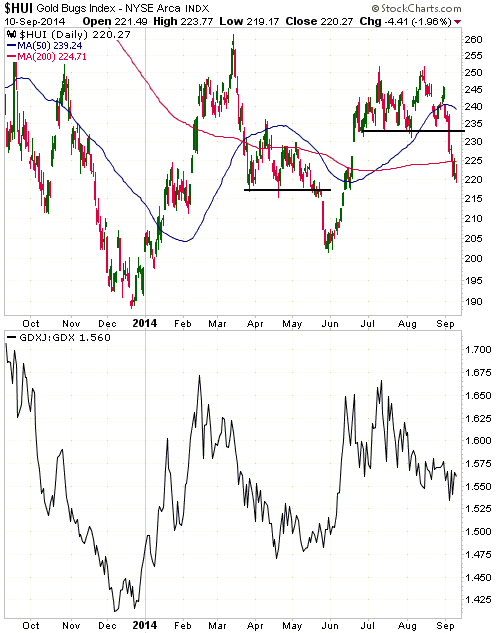
Last week's downside breakout in the HUI created a short-term chart-based target
of 215-220. The top of this range has been reached, but at this stage there is
no evidence that a bottom is in place.
With the help of the following chart, we point out the potential similarities
between the downside breakout of the past week and the downside breakout that
occurred in May. Notice that a short-term bottom was put in place only 2-3 days
after May's downside breakout. In this case, the break below support led to a
quick washout decline and an upward reversal.
Something similar could certainly be 'in the works' right now. If so, a bottom
would be put in place within the next couple of days, probably at around 215.
However, the chart also reveals a significant difference between the downside
breakout of the past week and the May breakout. We are referring to the fact
that the May breakout was not confirmed by the GDXJ/GDX ratio (when the HUI
plunged below support to a new multi-month low in May, GDXJ/GDX made a higher
low), whereas last Thursday's downside breakout was confirmed by a new
multi-month low in the GDXJ/GDX ratio.

The GDXJ/GDX ratio is the most important short-term indicator for the gold
sector at this time. Rather than trying to forecast when the next multi-week
rally would get underway, over the past few weeks we should have simply waited
for a signal from this ratio. There will likely be a very sharp rise in this
ratio at the beginning of the next tradable rally, just as there was in
late-December and early-June.
A few words about moving averages (MAs)
MAs are not natural support/resistance levels. They are simply trend-smoothing
devices. However, the most widely-followed MAs often act as support and
resistance because many short-term traders place orders near them. The gold
sector's recent price action provides these examples:
1) Last Friday's intra-day HUI low was 0.03 points above the 200-day MA
2) Tuesday's HUI close was 0.01 points above the 200-day MA
3) Tuesday's intra-day HUI high was 0.03 points below the 50-week MA
Gold-mining CEOs are generally clueless about gold
The CEOs of commodity-producing companies are usually knowledgeable about the
supply of and the demand for their company's products, but gold-mining CEOs are
exceptions. The vast majority of gold-mining CEOs have almost no understanding
of supply and demand in the gold market.
For example, like most gold-market analysts and commentators, most gold-mining
CEOs wrongly believe that the change in annual gold production is an important
driver of the gold price. In particular, they
talk about "Peak Gold" as if a leveling-off or a downward trend in global
gold-mine production would be very supportive for the gold price. This means
that they don't understand that the gold-mining industry's contribution to the
total supply of gold currently equates to only 1.5% per year, and, therefore,
that changes in industry-wide gold production will always be dwarfed -- in terms
of effect on the gold price -- by changes in investment/speculative demand. (And
by the way, changes in investment/speculative demand cannot be quantified by
looking at transaction volumes.)
Gold CEOs' general cluelessness about the gold market is reflected by the
performance of the World Gold Council (WGC). Every year, the WGC produces a pile
of completely irrelevant information about the gold market.
Fortunately, understanding the gold market has nothing to do with being a good
CEO of a gold-mining company. A good gold-mining CEO is someone who a)
implements strategies that keep total costs at relatively low levels, b)
prudently manages country, local-community, environmental and other political
risks, c) ensures that the balance sheet remains healthy, and d) only makes
acquisitions that are accretive.
The Currency Market
The British Pound's price on the foreign exchange market has obviously been
pushed down by the uncertainty stemming from next week's referendum on Scottish
independence. The Scottish referendum could also have contributed to the euro's
recent downside 'overshoot', because a "yes" vote, which started to look more
likely over the past week, could a) set in motion a chain of events that lead to
a UK exit from the European Union, and b) encourage secession movements in other
European countries. That's why the political and financial establishments have
been blowing the risks of Scottish independence out of all proportion. The goal
is clearly to provoke enough fear to prompt more than 50% of Scottish residents
to vote "no".
We will write more about the upcoming Scottish referendum's likely effect on the
British Pound in the Weekly Update. Suffice to say at this time that we do NOT
believe that a "yes" referendum outcome would be significantly bearish for the
Pound beyond short-term sentiment-driven fluctuations. We therefore think that a
further sharp sell-off in the Pound following a victory by the pro-independence
movement would create a good opportunity to begin accumulating an
intermediate-term 'long' position in this currency.

Updates
on Stock Selections
Notes: 1) To review the complete list of current TSI stock selections, logon at
http://www.speculative-investor.com/new/market_logon.asp
and then click on "Stock Selections" in the menu. When at the Stock
Selections page, click on a stock's symbol to bring-up an archive of
our comments on the stock in question. 2) The Small Stock Watch List is
located at http://www.speculative-investor.com/new/smallstockwatch.html
Chart Sources
Charts appearing in today's commentary
are courtesy of:
http://stockcharts.com/index.html

|

