|
- Interim Update 10th October 2007
Copyright
Reminder
The commentaries that appear at TSI
may not be distributed, in full or in part, without our written permission.
In particular, please note that the posting of extracts from TSI commentaries
at other web sites or providing links to TSI commentaries at other web
sites (for example, at discussion boards) without our written permission
is prohibited.
We reserve the right to immediately
terminate the subscription of any TSI subscriber who distributes the TSI
commentaries without our written permission.
Commodities
Commodities, Inflation, and the Coming Crack-Up Boom
Inflation (growth in the supply of money) is by far the most important
driver of the current long-term bull market in commodities.
Specifically, rapid growth in the GLOBAL supply of money has resulted
in the devaluation of currencies relative to commodities. Other asset
classes, including equities and real estate, have also benefited from
the inflation, but commodities have been the biggest beneficiaries
because they commenced the current cycle at very under-valued levels
relative to just about everything else. On the other hand, US equities
commenced the current cycle at very over-valued levels relative to just
about everything else and have therefore benefited from the inflation
to a much lesser extent. In general terms, inflation is creating a
rolling boom/bust cycle with relative scarcity and valuation
determining the asset classes that benefit the most during a particular
cycle.
Another important factor has been the failure of bond yields to respond
in the usual way to the obvious evidence of currency depreciation. What
we've had, in effect, is the combination of persistently high inflation
(money-supply growth and the associated fall in the purchasing power of
money) and persistently low inflation expectations. In other words,
despite the bountiful evidence that most currencies are depreciating at
rapid rates, confidence in the currencies and the central banks that
sponsor them has stayed at a reasonably high level. This has led to
gold, the confidence barometer, putting in a sub-par performance
relative to most other metals. It has also set the stage for dramatic
out-performance by gold over the coming several years because we can be
sure of two things: First, that the inflation will continue (there will
be interruptions from time to time, but governments and their central
banks have gone so far down the inflation path that turning back is no
longer an option); and second, that the inflation will EVENTUALLY cause
monetary confidence to collapse. A collapse in monetary confidence
resulting from an extended period of high inflation is what Ludwig von
Mises referred to as a "crack-up boom".
Inflation affects currency purchasing power in a non-uniform and
non-linear manner, resulting, early in the inflation cycle, in the
consequences of excessive money-supply growth being evident in only a
few sectors of the economy and in the general appearance of purchasing
power stability. The widespread belief is thus fostered that a high
rate of money-supply growth isn't really a problem in the "modern
economy". As described by von Mises (http://www.mises.org/humanaction/chap17sec8.asp):
"This first stage of the
inflationary process may last for many years. While it lasts, the
prices of many goods and services are not yet adjusted to the altered
money relation. There are still people in the country who have not yet
become aware of the fact that they are confronted with a price
revolution which will finally result in a considerable rise of all
prices, although the extent of this rise will not be the same in the
various commodities and services. These people still believe that
prices one day will drop. Waiting for this day, they restrict their
purchases and concomitantly increase their cash holdings. As long as
such ideas are still held by public opinion, it is not yet too late for
the government to abandon its inflationary policy.
But then finally the
masses wake up. They become suddenly aware of the fact that inflation
is a deliberate policy and will go on endlessly. A breakdown occurs.
The crack-up boom appears. Everybody is anxious to swap his money
against "real" goods, no matter whether he needs them or not, no matter
how much money he has to pay for them. Within a very short time, within
a few weeks or even days, the things which were used as money are no
longer used as media of exchange. They become scrap paper. Nobody wants
to give away anything against them."
The world appears to be moving inexorably toward a collapse in monetary
confidence, or "crack-up boom". However, while we can be reasonably
certain about the eventual outcome we cannot be certain about the
timing. Our guess is that the collapse won't occur until next decade,
but it could begin at any time and with little warning because things
tend to go 'haywire' all of a sudden when confidence in a currency
reaches the tipping point (the point when the masses finally wake up).
In the current environment it is therefore important to maintain a
substantial core position in gold-related investments at all times.
Current Market Situation
There are often links between different markets, but these links
usually aren't as strong as they've been over the past year. The
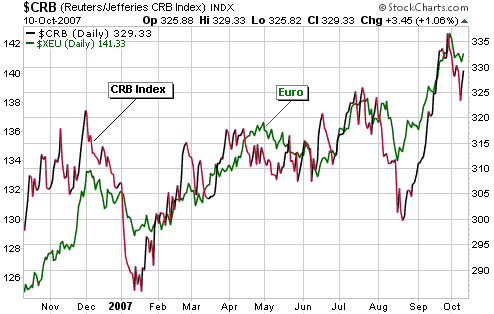
following chart, for instance, shows that over the past 12 months the
CRB Index and the euro have effectively been 'joined at the hip'.
The close relationship between the CRB Index and the euro reflected on
the following chart suggests that the next significant downturn in the
euro will be accompanied by a significant downturn in commodity prices.
Or, putting it another way, when the US$ eventually commences a rally
worthy of the name it will likely be accompanied by weakness in
commodity prices. This, in turn, means that when the euro embarks on
its next downward trend the commodity currencies such as the AUD and
the CAD are likely to do the same.
Further to the above
and as is currently the case with most markets, the short-term 'key'
for the commodity market is the US$. To be more specific, the commodity
market is likely to remain buoyant as long as the Dollar Index
continues its downward drift; and to sink once the dollar begins to
trend upward.
We continue to believe that the US$ is close to a bottom, but there is
nothing in the dollar's price action or in the performances of
inter-related markets to indicate that a bottom is already in place.
The Stock Market
Current Market Situation
In the latest Weekly Update we mentioned, in passing, that one of the
things not to like about the recent stock market advance was that it
had not been confirmed by breadth or volume indicators. Here's what we
meant by that comment:
First, the chart displayed below shows that neither the NYSE
advance-decline line nor the NYSE advance-decline volume line have
confirmed the recent moves to new highs by the senior stock indices.
This is the first non-confirmation of this type that has occurred over
the past three years.
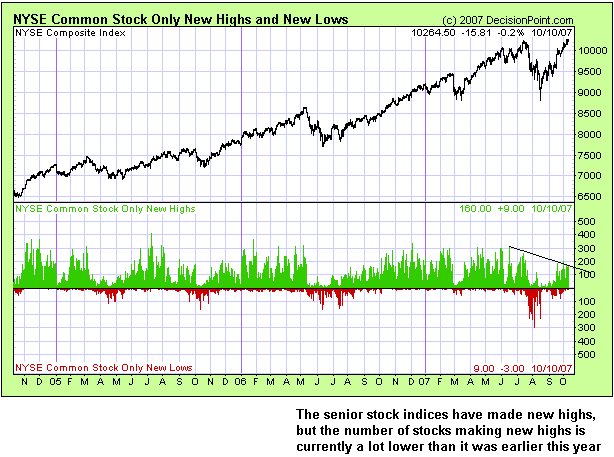
Second, as evidenced
by the following chart there are a lot less individual stocks making
new highs now than there were earlier this year, despite the new highs
of the senior stock indices.
Next, note that the
number of NYSE stocks above their respective 200-day moving averages
was 88% during the second quarter of this year and is now only 68%.
Also note that the number of NASDAQ stocks above their respective
200-day moving averages is currently only 41%, despite the stellar
performance of the NASDAQ Composite Index over the past year and
especially over the past two months.
We stress, though, that the breadth/volume non-confirmations described
above are not the main reasons for our short-term bearish outlook. The
advance has obviously been propelled by a relatively small number of
stocks, but our main concerns have revolved around widening credit
spreads, the relatively poor performance of the financial sector, and
the risk that the Yen would resume its rally (prompting a further
unwinding of the Yen carry trade).
We are bullish on the airline sector and on the Japanese stock market.
Also, we are turning bullish on the uranium and semiconductor sectors
on the expectation that rallies in these sectors will commence before
the end of this month. We remain bearish on the financial sector and
continue to perceive more short-term risk than potential reward in the
S&P500 Index.
Gold and
the Dollar
Gold Stocks and Gold Bullion
Current Market Situation
Based on what has happened over the past four years, the most likely
near-term outcome for the AMEX Gold BUGS Index (HUI) was that the
overbought extreme reached late last month would be followed by a
decline to the 340s. However, last week's sloppy performance by the US$
prompted us, in the latest Weekly Update, to give more serious
consideration to an alternative outcome that we described as follows:
"The alternative is that
the gold sector is in the process of doing something similar to what it
did during January-February of 2006.
...after the HGO
[HUI/Gold Oscillator] generated its sell signal in early January of
2006 the HUI and the HUI/gold ratio moved sideways for about three
weeks and then surged to form an important top -- marked by another HGO
sell signal -- at the beginning of February. The HUI's February-2006
peak was about 10% above its January-2006 peak, but...selling in
response to the January-2006 sell signal would still have worked out
OK.
...If the HUI does the
improbable (from our perspective) and closes above its late-September
peak within the coming week or so then we will assume that an
additional quick rise of around 10% lies in store."
The following chart of the HUI covers the action over the past 2 years
and thus shows what happened during the first quarter of 2006.
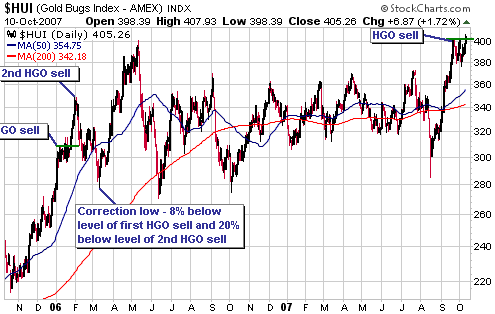
The HUI closed above
its September peak on Wednesday, thus potentially opening the door to a
10% (or thereabouts) surge over the coming week. If this happens then
another HGO sell signal will be generated next week and this new HGO
sell signal will, in all likelihood, be followed by a steep multi-week
decline that results in the HUI trading at least 10% below its CURRENT
level before the end of next month.
Now, we obviously can't rule-out a lengthier/larger advance because we
don't know what the future holds in store. We are simply dealing in
probabilities. What we can say is that with the HUI having broken-out
to the upside without having first pulled back far enough, or
consolidated for long enough, to alleviate its overbought extreme, the
probability is very low that a new multi-week upward trend has just
commenced. In our opinion there will either be an upside blow-off over
the next several days (as discussed above) or a breakout failure over
the next two days. A breakout failure, by the way, would be suggested
by a daily close below 400 and confirmed by a daily close below 380.
The likelihood that we will either get an upside blow-off over the next
several days or a breakout failure over the next two days is supported
by the following daily chart of December gold futures. Like the
gold-stock indices, gold bullion is extremely overbought on a
short-term basis (as evidenced, in the main, by the record-high
speculative net-long position in gold futures). However, being
overbought doesn't preclude an upside blow-off. In fact, upside
blow-offs, by definition, can only occur after a market has become
overbought.
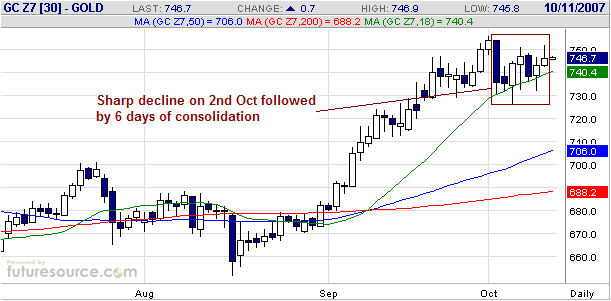
The following chart shows that December gold has spent the past six
trading days retracing the loss suffered on 2nd October. Consolidations
within short-term trends typically last 4-8 days, so the current
pattern should break one way or the other within the next three trading
days (likely before the end of this week). A daily close below the
18-day moving average (the green line on the chart) would be an early
warning sign that the breakout was going to be to the downside, while a
daily close above the 1st October high would obviously signal an upside
breakout.
If the breakout is to the downside then a quick drop to around $710
would probably ensue, whereas an upside breakout would probably be
followed by a quick move up to $775-$800. A drop to around $710 over
the next few weeks would, we think, constitute a short-term buying
opportunity IF there is still no evidence at that time of a US$ bottom.
Upside blow-offs in
gold and the major gold stocks over the coming week would, if nothing
else, be consistent with what's currently happening with Asian stock
markets, major diversified mining stocks, and the Baltic Dry Index.
What to do?
The current situation is very challenging for us from a
newsletter-writing perspective because the gold market has obviously
not performed in line with our expectations of late, but from a
personal money management perspective the situation is straightforward.
In our own account we raised a little more cash on Wednesday thanks to
one of our stocks hitting an above-the-market sell order, and if the
gold sector continues to surge over the coming days then one or two
more above-the-market sell orders might get hit. However, we won't be
doing a significant amount of selling because we have already scaled
back to near our "core" level of exposure (the overall level of
exposure that we will not go below as long as we believe the secular
bull market to be intact). We may, though, purchase some additional GDX
put options for insurance purposes.
To recap something we've explained in previous commentaries, we
maintain a substantial core position because we are always much more
confident about the long-term outlook than we are about the short-term
outlook. If we could see the future then a core position would not be
necessary -- we could simply move completely out of the market at
short-term tops and then move completely back in at the ensuing
short-term bottoms. However, lacking a reliable crystal ball we don't
attempt to time the market to that extent. Rather, we almost always do
some selling into extreme strength and some buying into extreme
weakness, all the while maintaining substantial core exposure in line
with the primary trend.
There are usually pros and cons to any strategy, and on the negative
side of the ledger is the fact that our core commitment will inevitably
cause us to suffer portfolio draw-downs during those periods when the
long-term bull market 'corrects' itself. However, this is a negative we
willingly accept. On the positive side of the ledger, it is not
possible for us to miss a short-term rally in the gold sector. When the
gold sector is in a strong short-term upward trend then we will either
make a lot of money or we will make an 'obscene' amount of money,
depending on whether or not we managed to anticipate the move.
But what about the people who do not currently have substantial "core"
exposure to the gold sector? What action(s) should they now take?
That's difficult to answer because core positions should be built up
over time during periods of weakness, not in response to upside
breakouts that occur with the market already very overbought. Many
small-cap gold stocks offer good value and are not extended from a
technical perspective, but almost all gold stocks will take a hit when
the next sector-wide downturn commences.
If you feel significantly under-exposed and want to be covered just in
case Wednesday's breakout is signaling the start of a major multi-month
rally, or even if you just want to position yourself for a possible
upside blow-off over the coming several days, then you could consider
taking a position in GDX and employing a fairly tight stop. You could,
for example, buy GDX with the plan to exit quickly if the HUI closes
below 395, and then switch to a 5% trailing stop if the HUI moves above
420.
The continuing lacklustre performance of junior gold stocks
Despite the HUI's move to new highs on Wednesday there continues to be
a general lack of interest in the small-cap gold stocks. A few of these
stocks have attracted some buying and experienced decent bounces of
late, but most remain a long way below their highs and are trading low
volumes. On the other hand, the small group of
over-valued/overbought gold stocks that has been responsible for the
bulk of the gains in the gold-stock indices over the past few weeks has
become even more over-valued/overbought.
If the rally continues for long enough it will broaden out and the
juniors will generate the sort of out-performance we saw during the
first half of 2006. However, the higher the indices go without a
sizeable correction the less chance there will be of the rally lasting
long enough to create broad-based strength.
Update
on Stock Selections
(Note: To review the complete list of current TSI stock selections, logon at http://www.speculative-investor.com/new/market_logon.asp
and then click on "Stock Selections" in the menu. When at the Stock
Selections page, click on a stock's symbol to bring-up an archive of our comments on the stock in question)
 It
was announced on Tuesday that Newmont Mining (NEM) has agreed to pay
$1.5B in cash for exploration-stage gold miner Miramar Mining (MNG) in
order to obtain the latter's in-ground gold resources in the remote
Nunavut region of northern Canada. This news doesn't affect us
directly, but NEM's bid has served to highlight the value in some TSI
stock selections. It
was announced on Tuesday that Newmont Mining (NEM) has agreed to pay
$1.5B in cash for exploration-stage gold miner Miramar Mining (MNG) in
order to obtain the latter's in-ground gold resources in the remote
Nunavut region of northern Canada. This news doesn't affect us
directly, but NEM's bid has served to highlight the value in some TSI
stock selections.
NEM's bid values MNG's total in-ground gold resource at $120/ounce and
its M&I (measured and indicated) gold resource at $247/ounce. In
contrast, the M&I gold resource of Metallica (MRB) is currently
being valued by the market at only $75/ounce; and that's excluding the
value of the huge copper resource at MRB's 30%-owned El Morro project.
It could be argued that comparing MRB and MNG is not valid because
MRB's resources are spread across two projects, one of which is only
30%-owned by MRB. Therefore, let's see how Minefinders (MFN) stacks up.
The market is currently valuing MFN's total in-ground resource at
around $75 per ounce and its M&I resource at $95/ounce. This means
that MFN is trading at a 37% discount to MNG based on total in-ground
ounces and at a 60% discount considering only the resources that have
been proved-up to M&I status. Is this discount reasonable?
We might be missing something, but it doesn't look reasonable to us
given that MFN is close to going into production whereas the time/cost
of mine construction lies well ahead for MNG.
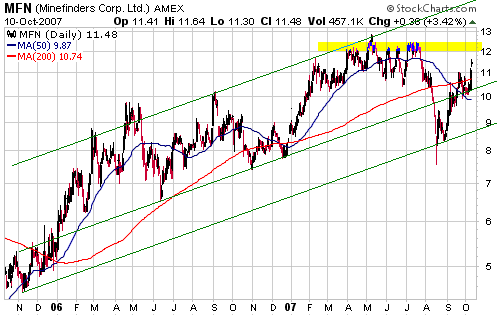
MFN is slightly overbought and is approaching resistance (see chart
below), but continues to offer good value and remains a candidate for
new buying on pullbacks.
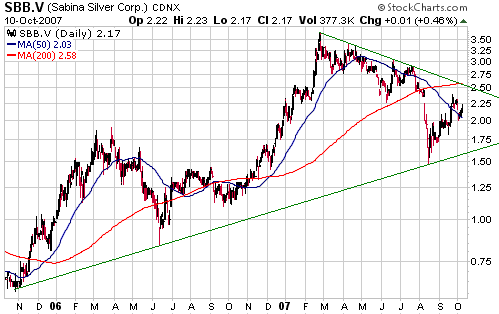
 Sabina Silver (TSXV: SBB). Shares: 66M issued, 83M fully diluted. Recent price: C$2.17 Sabina Silver (TSXV: SBB). Shares: 66M issued, 83M fully diluted. Recent price: C$2.17
NEM's decision to purchase MNG is a positive as far as SBB is concerned
because SBB's Hackett River project is in the same 'neck of the woods'
as MNG's Hope Bay project (Hackett River is about 250km south-west of
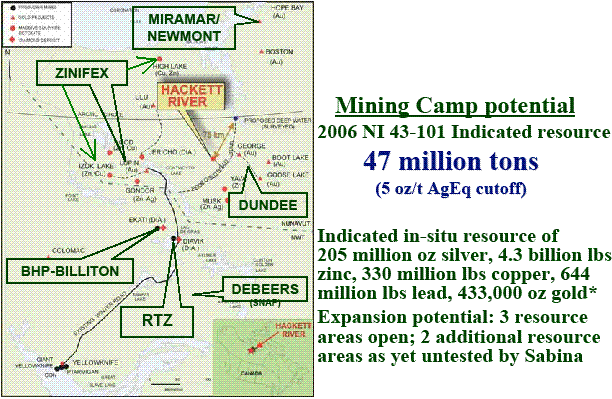
Hope Bay). In fact, the following graphic from SBB's company
presentation shows that although the Hackett River project may well be
located in a remote part of the world it is now surrounded by other
mining projects that are being operated/developed by major mining
companies. Not shown on this graphic is the Meadowbank gold project,
which is being developed by Agnico Eagle and is located several hundred
kilometers to the south-east of Hackett River.
Zinc producer Zinifex
(ASX: ZFX) is a likely acquirer of SBB at some point, but hopefully not
in the near future. SBB shareholders are likely to do much better if
the company remains independent for at least another year because the
Hackett River resource is huge relative to SBB's market capitalisation.
 Resolute
Mining (ASX: RSG). Shares: 278M issued, 280M fully diluted (incl.
shares added via current rights issue). Recent price: A$1.90 Resolute
Mining (ASX: RSG). Shares: 278M issued, 280M fully diluted (incl.
shares added via current rights issue). Recent price: A$1.90
TSI Stocks List member RSG, an Australian gold producer with most of
its assets in Africa, is giving existing shareholders a "right" to
purchase one new share at a price of A$1.10 for every five shares they
currently own. The rights are currently trading on the ASX under the
symbol RSGR and will cease trading on 22nd October.
Shareholders should either sell their rights prior to 22nd October or
exercise them as per the information they will receive directly from
the company. For Australia-based shareholders the decision as to
whether to sell the rights or exercise them will have to be made by
each individual based on whether he/she wants increased exposure to the
stock. However, shareholders with registered addresses outside
Australia won't have a choice in the matter in that a nominee appointed
by RSG will automatically sell the rights of non-residents and forward
to them the proceeds of the sale.
At RSG's current price of 1.90 the rights are worth 0.80 each (1.90
minus the 1.10 exercise price). This equates to 0.16 per share since
one right will be allocated for every five shares. For record purposes
we will assume that the rights are sold and will downwardly adjust our
original cost by 0.16.
We remain bullish on RSG. The company has a market capitalisation of
around US$470M (taking into account the shares added by the rights
issue), current production of around 250K ounces/year and a plan to
increase production to 500K ounces/year over the coming 12 months. This
works out to less than US$1,000 per ounce of production assuming the
planned production increase is achieved, versus an industry average of
more than $3,000 per ounce. Also of note: the company has 7.4M ounces
of gold in the M&I category, so it is currently trading at only
US$63 per M&I ounce.
Chart Sources
Charts appearing in today's commentary
are courtesy of:
http://stockcharts.com/index.html
http://www.futuresource.com/
http://www.decisionpoint.com/

|

