|
- Interim Update 10th December 2003
Copyright
Reminder
The commentaries that appear at TSI
may not be distributed, in full or in part, without our written permission.
In particular, please note that the posting of extracts from TSI commentaries
at other web sites or providing links to TSI commentaries at other web
sites (for example, at discussion boards) without our written permission
is prohibited.
We reserve the right to immediately
terminate the subscription of any TSI subscriber who distributes the TSI
commentaries without our written permission.
Gold stocks
in a general market decline
This is a subject we've tackled in
previous commentaries over the past two years. However, given how close
we probably are to a peak in the general market and in light of the 'investment
advice' that has been spewing forth from some gold-related web sites of
late, now is probably as good a time as any to re-visit the topic.
First, let's take a look at what happened
when the stock market was tumbling during the mid-1970s.
Below is a chart comparison of, from
top to bottom, the gold price, the Barrons Gold Mining Index, and the Dow
Industrials Index from the beginning of 1972 through to the end of 1975.
We discussed a similar chart comparison more than one year ago, but as
mentioned above the time is right for a recap.
The Dow Industrials Index peaked in
January of 1973 and then began to move lower in a slow and steady fashion
such that by March of 1974 it was only about 14% below its peak. However,
its rate of descent then began to accelerate and over the ensuing 6 months
it fell by another 30%. Point A on the above chart marks the time at which
this accelerated decline got underway. Point B on the chart marks the peak
for gold stocks and Point C marks the peak for the gold price.
Notice that gold stocks moved to a
new high after the Dow began to accelerate lower, but then made a huge
catch-up move (the Barrons Gold Mining Index lost about 45% of its value
in the space of about 4 weeks during August-September 1974). In fact, all
the gains achieved by gold stocks during the first 8 months of 1974 were
wiped out in less than one month. Also, notice that the gold price continued
higher for a few months and gained another 25% AFTER gold stocks peaked.
The bottom line is that although gold
stocks went on to make a new high sometime after the Dow had begun to accelerate
lower, anyone who had exited their gold stocks at around Point A on the
above chart could have bought them back at much lower prices about six
months later.
Next, let's take a look at what happened
when the stock market tumbled during 1987.
Below is a chart comparison of, from
top to bottom, the gold price, the XAU, and the Dow Industrials Index from
May 1986 through to the end of 1987.
The Dow peaked in late August of 1987
(Point A on the above chart) and the XAU peaked about three weeks later
(Point B on the chart). Gold, however, continued to move higher for about
three months after gold stocks had peaked.
Notice that the sequence followed by
the Dow, gold stocks and the gold price in 1987 was similar to the sequence
followed by these markets in 1974 with the main difference being that everything
happened in a compressed timeframe during 1987. In both cases, though,
gold stocks lost about 45% of their value in quick time once the Dow began
to accelerate lower even though the gold price continued to rise.
Just for the sake of interest, points
'a', 'b', and 'c' on the above chart show the 'crash rehearsal' that happened
in April 1987.
The above are brief descriptions of
what happened to gold stocks and the gold price during the most important
stock market declines of the 1970s and 1980s, but there is no need to look
back that far to get a sense of how gold stocks tend to fare when the broad
stock-market is dropping at a rapid rate. For example, the Dow peaked in
March of 2002 and over the next 2 months moved lower at a slow and steady
pace. During this period gold stocks did extremely well, but during the
second half of May the Dow's decline began to accelerate and gold stocks
were dragged lower to the extent that the AMEX Gold BUGS Index lost 40%
of its value during June-July of 2002.
Based on the above as well as on other
historical performance data, it seems that:
a) Gold shares drop sharply when the
broad stock market accelerates lower. In fact, as far as we can tell there
aren't ANY historical examples of gold shares rising while the broad market
tanks.
b) When gold shares have been rallying
with the broad stock market they are even more vulnerable to a general
stock market decline. In fact, when gold shares rally with the overall
market over an extended period they tend to fall by an even greater percentage
amount than the broad market during the ensuing decline.
c) During a large decline in the broad
stock market it is quite common for the prices of gold shares to drop sharply
while the price of gold bullion -- the ultimate safe haven -- moves higher.
Now, just because something happened
in a particular way in the past doesn't mean it will happen the same way
in the future. In this case, however, there are two very good reasons to
expect that the past will be prologue, the first of which relates to the
ownership structure of gold shares.
Those who expect gold shares to continue
moving higher in the face of a sharp drop in the broad stock market are
failing to take into account the fact that many of the people who own gold
shares also own other shares. Regardless of how bullish the economic/financial
backdrop might appear to be for gold and, therefore, for gold shares, when
stock-market investors are forced to sell they will sell whatever they
own (including gold shares). And because the entire gold sector is tiny
compared to many other sectors of the market it tends to have an outsized
response to incremental changes in buying and selling pressure. This, we
think, explains why the popular gold-stock indices have often fallen further
than the Dow Industrials Index during substantial declines in the general
market.
The second reason for what, at first
glance, might appear to be a rather strange tendency for gold stocks to
plunge with the broad stock-market while the gold price moves higher has
to do with the fundamental difference between gold and gold shares. In
a nutshell, gold is money whereas gold shares are financial assets.
In times of financial-market crisis people flee to the safety of money
and sometimes (depending on the nature of the crisis) to government bonds.
They never flee to equities, even gold equities.
In conclusion, we don't think there's
any question that gold shares will be hit hard once the general equity
market embarks on the accelerated phase of its next major decline.
And this, by the way, means that the more successful are the Fed and the
US Government at postponing the next major stock-market decline the better
it will be for investors in gold stocks.
The US
Stock Market
The Fed
Over the past few months our expectations
have been that a) the outcome of the Fed's December meeting would be a
statement to the effect that inflation risks had come into balance, b)
the outcome of the late-January meeting would be a move to a 'tightening
bias', c) the first interest rate hike would occur in March, and d) the
Fed would be forced to hike rates aggressively during the second half of
2004. So far so good, as the statement issued following Tuesday's FOMC
Meeting was in line with the first of these expectations. Specifically,
the relevant section of Tuesday's statement was: "The probability of
an unwelcome fall in inflation has diminished in recent months and now
appears almost equal to that of a rise in inflation." This is a significant
change from the wording included in the previous statement, which was:
"...the
probability, though minor, of an unwelcome fall in inflation exceeds that
of a rise in inflation from its already low level. The Committee judges
that, on balance, the risk of inflation becoming undesirably low remains
the predominant concern for the foreseeable future."
Some commentators have fixated on the
Fed's assertion -- an assertion that has appeared in the last few monetary
policy statements -- that "policy accommodation can be maintained for
a considerable period". These words re-appeared in the latest statement,
but we think there's an important distinction between a commitment to "policy
accommodation" and a commitment to NOT raise official interest rates. In
fact, Greenspan has probably chosen these words knowing that they would
be misconstrued by most people as meaning "no rate hikes for a considerable
period" when, in fact, interest rates are now so low that it would be possible
to make several rate hikes of 25 basis points a piece whilst maintaining
"policy accommodation". This distinction might 'hit home' in January if
the Fed starts talking about risks being skewed towards rising inflation
whilst still maintaining its commitment to "policy accommodation" for a
"considerable period".
As far as the US$ and the US stock
market are concerned, we think the latest statement is reasonably well
worded. As noted in the Weekly Update, if the members of the monetary policy
committee had continued to spout the ridiculous notion that "the risk
of inflation becoming undesirably low remains the predominant concern for
the foreseeable future" then the Dollar might have collapsed. And a
collapsing Dollar would, in all likelihood, create a problem for the stock
market.
Current Market Situation
One of our most important indicators
is the ratio of the NASDAQ100 Index (NDX) and the Dow Industrials Index
and we've just seen the most significant downward reversal in the NDX/Dow
ratio since the first quarter of 2002.
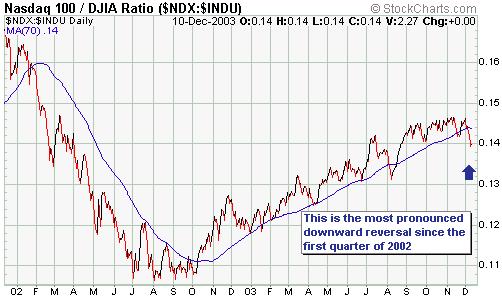
When the trend in the NDX/Dow ratio
reverses from up to down -- a trend change which is indicated, for our
purposes, by a decisive move in the ratio below its 70-day moving average
-- it is a sign that market participants are starting to become more risk
averse (because the Dow stocks are generally considered to be less risky
than the NDX stocks). An increase in the level of risk aversion is, in
turn, something that tends to occur during the final stages of an advance
or the early stages of a decline. The recent under-performance of the NDX
relative to the Dow could therefore be an indication that an important
peak is close at hand.
NDX/Dow broke down in January-February
of 2002 but the Dow Industrials Index went on to make a new recovery high
in March of 2002. It is quite likely, we think, that a similar pattern
is unfolding right now. For instance, the Dow achieved a new recovery high
earlier this week whereas the NDX is yet to better its 7th November peak.
We expect that the Dow will move to
higher levels over the coming month or so, but the recent performance of
NDX/Dow suggests that now is a reasonable time for us to start building
a bearish position in anticipation of the next major decline. We will therefore
add an initial position in USPIX (http://finance.yahoo.com/q/pr?s=USPIX),
a leveraged fund that moves inversely to the NDX, to the TSI Stocks List
using Thursday's closing price for record purposes. Our expectation is
that we will end up with a total of three positions in USPIX purchased
at different levels over the next few months.
USPIX can be purchased by people inside
and outside the US via most US brokers. The fund manager (ProFunds) stipulates
a minimum initial investment of US$15,000, but different brokers will have
different minimum investment limits depending on the arrangement they have
with ProFunds. For example, if you buy USPIX via Barry Murphy and Co. --
a US-based brokerage we have suggested in the past for the low-cost trading
of Canadian shares -- there is no minimum initial investment.
An alternative to buying USPIX would
be to buy some QQQ put options (for example, the June-2004 or January-2005
$30 puts).
Note: Whether you attempt to profit
from a market downturn via USPIX (or some other leveraged bear fund) or
via put options, you should not be doing so with money you cannot afford
to lose. These are high-risk speculations that offer the potential for
high reward.
Gold and
the Dollar
Gold and the Dollar - contemplating
some possibilities
Whenever we start discussing 'alternative
scenarios', as we occasionally do at TSI, we run the risk that we are going
to confuse some of our readers. But so be it. In the markets there are
always many possible outcomes and it behooves a good analyst or investor
to be continually weighing a range of possibilities. We could, of course,
weigh the various possibilities out of sight of our readership and simply
present the end result of our contemplation at TSI. If we did this there
might be less chance of any one commentary creating confusion, although
such an approach might give the impression that we are dealing with certainties
as opposed to probabilities.
Our preferred approach is to let our
readers know what we think is going to happen and why, and also, from time
to time, to outline what we consider to be lower-probability outcomes.
For example, a discussion of lower-probability outcomes tends to be particularly
appropriate when a market has reached a critical decision point. At such
a time we might conclude that the odds favour one outcome, but these are
also the times when it wouldn't take much to change the expected outcome
in a very big way.
At the end of last week the currency
market was very close to a critical decision point (and still is, as a
matter of fact). The Dollar Index, the euro and the Swiss Franc ended last
week within 1% of our target levels, so these currencies were either about
to reverse course or something other than our expected outcome was about
to occur. The most likely alternative to the reversals we were anticipating
was an acceleration in the direction of the current short-term trends,
so we thought it was appropriate to mention this alternative and briefly
address some of its implications. Note, though, that our forecasts for
the currency and gold markets were not modified in any way by the commentary
that was posted last weekend. In fact, near the end of the 'alternative
scenario discussion' in the Weekly Update we said "the odds continue
to favour a short-term bottom for the US$ occurring near its current level".
Current Market Situation
Our 410-420 short-term target for the
gold price was based on our expectation that gold would trade up to the
long-term resistance range shown on the below monthly chart before spending
some time consolidating below this resistance. As mentioned in the latest
Weekly Update it is possible that the gold price will spike above this
resistance range at some point over the next few weeks (e.g., to our intermediate-term
price target of $460), but we think a sustainable move above 420
at this time has a low probability of occurring. This is because it would
be very unusual for a market to move relentlessly higher for several months
into an area of long-term resistance, as gold has just done, and then just
continue to trend higher without experiencing any kind of shakeout or lengthy
consolidation.
Below is a monthly chart of Swiss Franc
futures. As is the case with the gold market, our 78-80 short-term upside
target for the SF was based on our expectation that it would trade up to
long-term resistance and then consolidate for a while. Once again, a spike
above resistance is certainly possible in the short-term. However, our
view is that a sustainable move above 80 at this time has a low probability
of occurring.
Gold Stocks
In the 1st December Weekly Update we
said "The recent price action in both NEM and the HUI suggests that
a pullback has a good chance of occurring over the coming 2-4 weeks. We'd
then expect a final surge to a new high for the year, although given how
expensive many of the HUI components are relative to the metal price the
ultimate high might be only slightly (5%-10%) above the current level [the
HUI was trading at 248 at the time]. We do, however, think that many of
the junior gold (and silver) stocks -- the ones that aren't expensive relative
to the current metal price -- have the potential to move considerably higher
over the next 2 months." We then reiterated the valuation risk in the
gold sector in the 3rd December Interim Update and the 8th December Weekly
Update. Hopefully, most of our readers got the message.
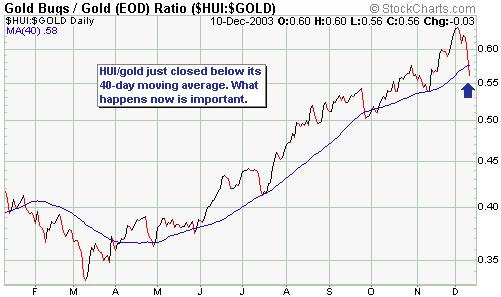
The 2-4 week correction we envisaged
is obviously underway and a critical decision point has just been reached
because yesterday (Wednesday) the HUI/gold ratio closed below its 40-day
moving average (see chart below). Now, a marginal break below the 40-day
moving average is meaningless because there is nothing magical about this
particular moving average other than the fact that it has worked well for
the purpose of identifying trend changes over the past 3 years. What would
be meaningful, however, would be continued deterioration in the HUI/gold
ratio over the next few days.
For the HUI itself a support level
to watch over the next few days is the support defined by the October peak
(see chart below).
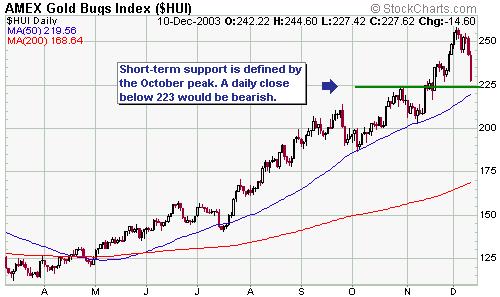
A continued decline in HUI/gold combined
with a daily close below 223 in the HUI would be compelling evidence that
an intermediate-term peak was in place for the gold sector. However, even
if this evidence does materialise it should not be interpreted as a signal
to immediately liquidate all gold-stock holdings, for two reasons. First,
after a market makes an important peak and then drops sharply a rally invariably
occurs that retraces at least 50% (potentially as much as 100%) of the
initial decline. If you miss the chance to take profits near the peak then
the next best time to take them is during the retracement rally following
the initial decline. Second, even if the HUI has peaked we expect that
some of our junior gold (and silver) stocks will make new highs over the
coming months in response to exploration/acquisition news.
As far as we are concerned, now is
NOT an ideal time for a peak in the gold sector. This is because the Dow
Industrials Index has either just peaked this week or, more likely, is
going to peak early next year, and the strong tendency is for gold stocks
to peak a few weeks or more AFTER the Dow. It would therefore make more
sense to us if the HUI held above support and proceeded to new highs over
the next 1-2 months. We will, though, respect our indicators if they happen
to signal that a peak is already in place.
By the way, the reason we continue
to believe that the junior gold stocks, as a group, are far more attractive
than the senior and mid-tier gold stocks isn't that we don't think they
will get hit hard in a general gold-sector downturn. Rather, it is because
their downside risk is more than offset by their upside potential. In other
words, the downside risk might be great but some of these stocks are still
attractive from a risk/reward perspective because the potential rewards
are even greater
Update
on Stock Selections
 Shares
of South African gold miner Afrikander Lease (OTC: AFKDY) plunged by 30%
on Tuesday in reaction to the company's announcement that it is going to
mothball part of its operations due to the low Rand gold price. It then
fell by another 20% on Wednesday after being down by as much as 50% at
one point. Shares
of South African gold miner Afrikander Lease (OTC: AFKDY) plunged by 30%
on Tuesday in reaction to the company's announcement that it is going to
mothball part of its operations due to the low Rand gold price. It then
fell by another 20% on Wednesday after being down by as much as 50% at
one point.
We think the stock market's reaction
to this announcement has been rather strange, to say the least, given that
a press release issued by Aflease back on 14th November said that consideration
was being given to curtailing operations. Clearly, there is no point in
producing gold if the cost of production is in excess of gold's current
market price. Instead, it makes sense to leave the gold in the ground until
the gold price moves high enough to enable mining to be carried out at
a profit. Tuesday's news should therefore not really have been news at
all, which is why we say the market's reaction was rather strange.
It is possible that Aflease's latest
message has been misinterpreted. In particular, it should be stressed that
the company is not closing all its operations, it is only closing the low-grade
'open cast' operations at the Inner Basin. Aflease will continue with development
of the much higher-grade operations at Bonanza and Modder East (these operations
will be brought into production over the next 2 years) and it will be producing
gold at the rate of 80,000-100,000 ounces per year from the profitable
Kalgold operation recently purchased from Harmony. Also, the operations
that have just been mothballed will be put back on line once the Rand gold
price recovers.
When the McWatters Mining stock price
plunged a few months ago in response to a decision to cease mining operations
we didn't see any reason to hold onto the stock. This was because we had
no reason to be confident in the ability of the management to effect a
turnaround and also because at least 90% of the company's value was tied
up in the asset that was being closed. Aflease, though, has several other
valuable assets (including, by the way, a large uranium deposit that is
currently being valued at zero by the stock market) and very capable management.
We therefore would NOT be selling into the current weakness. On the contrary,
this appears to be a buying opportunity.
Exeter
Resource (TSXV: XRC) is raising C$3.6M via the issue of 3.6M new shares
at C$1.00. This money will be used to advance the company's La Cabeza gold
project and other projects in Argentina.
As far as micro-cap gold mining companies
are concerned, XRC is relatively low risk as its current market price is
more than fully justified by its defined gold resources and its ownership
structure is solid (company insiders own a large chunk of the company).
This is one stock that we expect will hit new highs over the coming months.
In
the latest Weekly Update we provided, for the benefit of those who currently
have almost no exposure to the gold sector, a list of juniors that
would be suitable for accumulation on weakness. To that list we would add
Desert Sun Mining (TSX: DSM) at around C$1.50 and Afrikander Lease at around
US$0.40.
Chart Sources
Charts appearing in today's commentary
are courtesy of:
http://stockcharts.com/index.html
http://www.futuresource.com/

|
