|
- Interim Update 11th January 2006
Copyright
Reminder
The commentaries that appear at TSI
may not be distributed, in full or in part, without our written permission.
In particular, please note that the posting of extracts from TSI commentaries
at other web sites or providing links to TSI commentaries at other web
sites (for example, at discussion boards) without our written permission
is prohibited.
Bonds
The Conundrum
...it
will only be feasible for foreign central banks to continue their
practice of absorbing large quantities of US debt as long as these
central banks aren't facing an inflation problem at home.
Inflation expectations remain low. How do we know? First, because the
difference between the yield on a 10-year T-Note and the yield on a
10-year Inflation-Protected T-Note is currently only 2.37%, which
suggests that the market is expecting the CPI reported by the US
Government to gain an average of 2.37% per year over the next 10 years
(the inflation rate and the rate of increase in the CPI are totally
different things, but most market participants believe them to be one
and the same so the expected CPI is a reasonable measure of inflation
expectations). Second, the US stock market's high price/earnings ratio
is evidence that most market participants consider the past few years'
growth in corporate earnings to be real (not inflation-induced) and
expect additional real (non-inflationary) earnings growth over the
coming years (the stock market always prices 'real' earnings growth at
a much higher level than earnings growth resulting from inflation).
Third, there's not much of an inflation premium in the current gold
price (gold has done well over the past year in terms of most fiat
currencies, but it hasn't done well relative to most other metals).
The persistently low level of inflation expectations, rather than the
failure of US bond yields to rise in response to the Fed's rate-hiking
campaign, is the true conundrum as far as we are concerned.
Perhaps the answer is that the markets expect foreign central banks to
continue buying enough US debt to keep long-term interest rates at a
low level regardless of what's happening on the inflation front. If so
then the markets will eventually be disappointed because it will only
be feasible for foreign central banks to continue their practice of
absorbing large quantities of US debt as long as these central banks
aren't facing an inflation problem at home. The reason is that the
process that ends with a foreign CB buying a large chunk of US debt
begins with the foreign CB printing a large quantity of its own
currency (Yen, Yuan, etc.). In other words, when a foreign CB provides
artificial support to the US bond market it does so via the inflation
of its own currency.
Current Market Situation
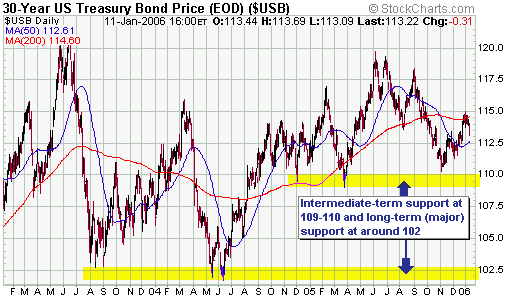
The following chart of T-Bond futures shows two important support
levels. If support at 109 gives way then a test of support at 102 will
become a likely short-term prospect, and if support at 102 gives way
then there will be little doubt that a secular bear market commenced in
June of 2003.
In our opinion, one
of the biggest short-term risks for the bond market is that the Fed
ends its rate-hiking campaign too soon. Additional rate hikes won't
present a problem for bonds because they will tend to suppress
inflation expectations and economic growth expectations, but if the Fed
decides to stop hiking rates while the gold, commodity and stock
markets are still in short-term up-trends then bonds will probably
tank. We will be surprised if the Fed does signal an end to the
monetary tightening as long as the aforementioned markets are still in
rally mode, but given this risk and the fact that bond futures closed
marginally below a short-term support level on Wednesday we are
shifting our short-term bond market view from "neutral" to "bearish".
The Stock Market
Airline Stocks vs Oil Stocks
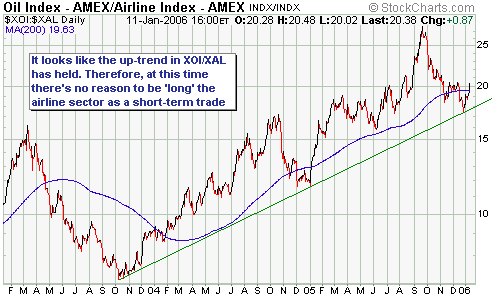
The below chart of the XOI/XAL ratio -- the AMEX Oil Index divided by
the AMEX Airline Index -- shows a spike below the 200-day moving
average during December followed by a sharp recovery to above the
200-day MA during the first 7 trading days of this year. This is an
indication that the intermediate-term upward trend in oil stocks
relative to airline stocks is intact. We are therefore going to
immediately exit our short-term bet on the airline sector at a profit
of 17.4% based Wednesday's closing level of 52.61 for the XAL and our
mid-October entry at 44.82. We will consider trading the airline sector
from the long side again if the XAL closes above 56 and/or the XOI/XAL
ratio drops back below its 200-day MA.
Current Market Situation
...there is probably more upside in store for the US stock market over the next couple of months, but not a lot more.
One of the stock market indicators we monitor is the SOX/NDX ratio (the
Semiconductor Index divided by the NASDAQ100 Index). This indicator is
similar to the NDX/Dow ratio in that a rising trend in SOX/NDX suggests
that market participants are becoming less risk averse -- a short-term
bullish development and, when the market is very over-valued as it is
right now, a prerequisite for a rally. On the other hand, a falling
trend in SOX/NDX is indicative of increasing risk aversion -- something
that tends to occur near the ends of rallies and during the early
stages of intermediate-term declines. The reason the ratio operates in
this way is that the semiconductor stocks are generally considered to
be riskier than the NASDAQ100 components.
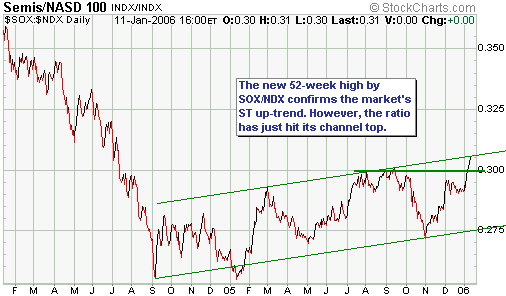
The following chart shows that SOX/NDX has just moved to a new 52-week
high, which suggests to us that the stock market rally is not yet over.
However, the ratio has also just hit the top of the channel in which it
has been trading over the past 16 months.
Our short-term view -- which is supported by the performance of SOX/NDX
-- is that there is probably more upside in store for the US stock
market over the next couple of months, but not a lot more. As advised
in the 10th January Market Alert E-mail, we've therefore shifted our
short-term stock market view from "bullish" to "neutral".
Gold and
the Dollar
Gold Sentiment
...most
exploration-stage stocks did very little for many months as the gold
price and the prices of the major gold shares drove upward, but these
small-cap stocks have now come to life in spectacular fashion in
response to a surge in the public's enthusiasm.
Some people are bullish regarding the short-term prospects for gold and
gold stocks because they think the majority (the public) is too
bearish, whilst other people are anticipating a sharp sell-off because
they think the majority is too bullish.
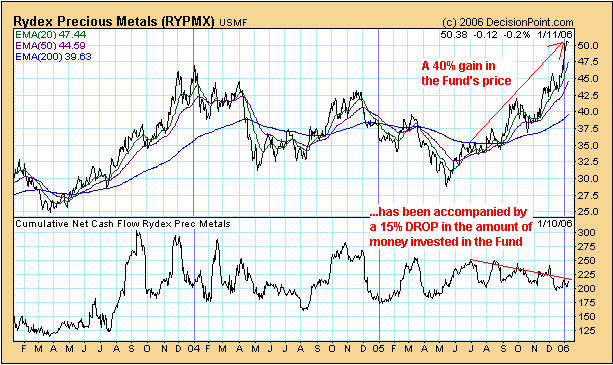
Supporting the view that sentiment is a long way from reaching a
bullish extreme is the cumulative cash flow of the Rydex Precious
Metals Fund (Rydex PM), a fund that holds the shares of companies that
mine precious metals. Specifically, the below chart shows that the 40%
gain in the price of Rydex PM since the beginning of July-2005 has been
accompanied by a 15% FALL -- from US$250M to US$211M -- in the net
amount of cash invested in the Fund. In other words, the Fund has
suffered net REDEMPTIONS totaling $43M in parallel with a 40% increase
in its price.
This type of divergence borders on the ridiculous and we wonder if
there's something totally unrelated to sentiment that has caused it.
One of our readers suggested that people who might otherwise have been
putting money into Rydex PM have, instead, been investing in
Streettracks Gold Trust, a gold bullion ETF that trades on the NYSE
under the symbol GLD. This might be part of the reason, although GLD
didn't suddenly come into existence during the second half of last year
(it was introduced during the final quarter of 2004). And Rydex PM has
outperformed GLD by a wide margin over the past six months so anyone
being drawn into the market by price action would have had no reason to
favour GLD over Rydex PM. Unfortunately, we don't have cash flow
figures for other PM-related funds and therefore can't check if the
curious Rydex PM situation is fund-specific or indicative of a broader
trend.
The relatively low
level of the small traders' net-long position in COMEX gold futures
also supports the view that the public is yet to become very bullish on
gold.
There is, however, plenty of evidence in support of the opposing view
(the view that sentiment is approaching a bullish extreme). For
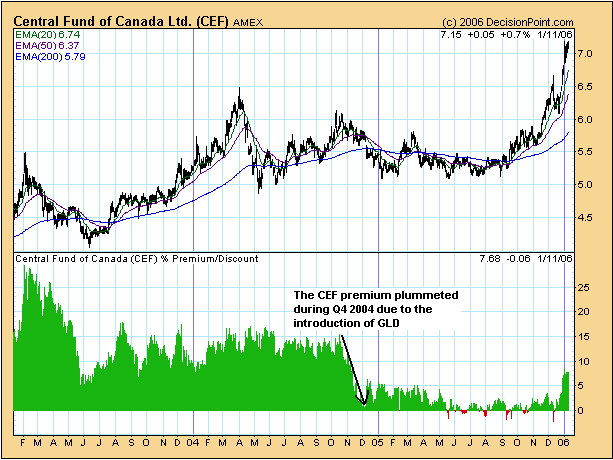
example, the premium over net asset value (NAV) at which the Central
Fund of Canada (AMEX: CEF) trades has risen from zero to around 7.5%
over the past month (see chart below). Now, a premium of 7.5% is
obviously a lot lower than the 25% premium at which CEF traded in early
2003 and the 15% premium at which it traded during much of 2004;
however, the 2003 and 2004 premiums are not comparable to the current
premium because the Streettracks gold ETF (NYSE: GLD) -- a fund that
invests in gold bullion and trades with no premium -- was introduced in
late 2004. Since that time (late 2004) there has been no good reason
for CEF to have any premium whatsoever except for the fact that 50% of
its assets are held in the form of silver bullion and there is
presently no silver ETF (there is no way for people to buy exposure to
silver bullion in the stock market other than to buy the shares of
CEF). Therefore, the current 7.5% premium for CEF is probably best
understood as a 0% premium for the Fund's gold holding combined with a
15% premium for the Fund's silver holding. In other words, although
silver is currently trading at US$9.00/oz today's buyers of CEF are, in
effect, paying $10.35/oz. This suggests a high level of optimism.
On a side note, we suggested buying CEF at around US$5.50 in September
when it was trading at a small discount to NAV and again at around
$6.20 in December when it was trading at a small premium to NAV, but we
would not be buyers at the current high premium. If a silver ETF is
introduced then the CEF premium will drop to around zero.
Another indication
that the public has embraced the gold rally is the goings-on at the
speculative end of the gold share universe. Specifically, most
exploration-stage stocks did very little for many months as the gold
price and the prices of the major gold shares drove upward, but these
small-cap stocks have now come to life in spectacular fashion in
response to a surge in the public's enthusiasm. On a related matter, a
few months ago the stock market was generally ignoring good news
announced by 'the explorers', and newsletter/brokerage buy
recommendations were having almost no effect on stock prices. Recently,
however, small stocks have been rocketing higher in response to
positive publicity. For example, over the past week we've seen our
Desert Sun Mining shares gain 30% in two days in response to a buy
recommendation from Canaccord and our Exeter Resources shares gain 24%
in one day in response to a buy recommendation from Casey Research.
Weighing all the evidence, we don't think there's much doubt that
sentiment towards the gold sector is bullish. However, the current
optimism about the future prospects of gold and gold shares goes
hand-in-hand with the current optimism towards commodities in general
and shares in general. Most prices continue to be pushed higher by a
rising sea of liquidity and when liquidity is abundant the future
almost always looks bright.
Currency Market Sentiment
Based
on the pattern of the past few years, the current upward correction in
the Swiss Franc (downward correction in the Dollar Index) won't end
until AFTER speculators in Swiss Franc futures have become net-long.
One of the most reliable indicators of sentiment in the currency market
is the speculative position in Swiss Franc futures. However, like all
sentiment indicators this one needs to be recalibrated based on the
market's price trend. This is because 'overbought' and 'oversold'
extremes occur at different levels depending on whether a bull market
or a bear market is in progress.
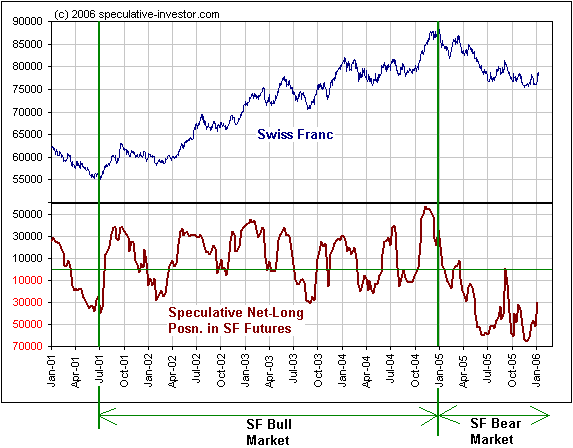
The following chart compares the Swiss Franc (SF) with the speculative
net-long position in SF futures. With reference to this chart, notice
that:
a) Between July of 2001 and December of 2004 -- a period during which
the SF was in a bull market -- the speculative net-long position in SF
futures spent most of the time above zero (speculators were generally
'long' in line with the bullish price trend). Also, interim peaks in
the SF generally didn't occur until after the speculative net-long
position had moved up to the 30,000-40,000 range and the speculative
net-long position never dropped below -30,000.
b) Between January of 2005 and the present day -- a period during which
the SF was in a bear market -- the speculative net-long position in SF
futures spent almost the entire time below zero (speculators were
almost always 'short' in line with the bearish price trend). Also,
interim bottoms in the SF didn't occur until after the speculative
net-long position had moved below -60,000 and the two interim tops --
in mid March and early September of 2005 -- occurred soon after the
speculative net-long position moved above zero.
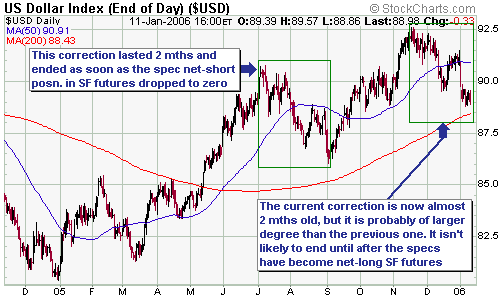
The latest
Commitments of Traders (COT) report revealed that the total speculative
net-long position in SF futures was around -30,000 (large and small
speculators, as a group, were net-short the SF to the tune of around
30,000 contracts). Based on the pattern of the past few years, the
current upward correction in the Swiss Franc (downward correction in
the Dollar Index) won't end until after speculators in Swiss Franc
futures have become net-long. Furthermore, the current correction is
probably of larger degree than either of last year's corrections and
therefore might not end until after the speculative net-long position
in SF futures has moved up to around 20,000 contracts.
Current Market Situation
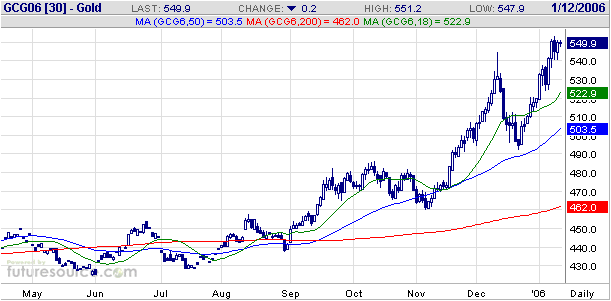
The jury is still out as to whether or not gold is in the process of
making a double top. In favour of the view that higher levels will be
seen over the next few weeks is the simple fact that there has not yet
been any sort of downward reversal; instead, after moving up to the
vicinity of its December peak the gold price has oscillated within a
narrow range. The other side of the coin is that a consensus seems to
be building -- even amongst those who aren't usually very bullish on
gold -- that a move up to $600 is imminent. When high price targets
start being bandied about by mainstream analysts a short-term peak is
probably not far away.
We think gold's best chance of making it to $600 in the near future
would be if it first pulled back to the 520s before moving back up to,
and through, the 540s.
Please refer to the
latest Weekly Market Update for our short-term outlook for gold stocks.
Our view, in a nutshell, is that a blow-off move is underway. This
blow-off move will end soon, but even if it lasts only 2-3 more weeks
it will yield some additional large gains for the holders of
exploration-stage stocks. Keep the upside target-ranges mentioned in
the 4th January Interim Update in mind and don't forget to take partial
profits if the stocks spike up to these levels.
Chart Sources
Charts appearing in today's commentary
are courtesy of:
http://stockcharts.com/index.html
http://www.futuresource.com/
http://www.decisionpoint.com/

|

