|
- Interim Update
11th February 2015
Copyright
Reminder
The commentaries that appear at TSI
may not be distributed, in full or in part, without our written permission.
In particular, please note that the posting of extracts from TSI commentaries
at other web sites or providing links to TSI commentaries at other web
sites (for example, at discussion boards) without our written permission
is prohibited.
We reserve the right to immediately
terminate the subscription of any TSI subscriber who distributes the TSI
commentaries without our written permission.
Japan
still has the world's slowest monetary inflation rate
The green line on the following chart shows the annual rate of
change of Japan's monetary base (MB). It looks like a brainwave scan
of a person experiencing a seizure. The red line on the following
chart shows the annual rate of change of Japan's M2, a proxy for the
economy-wide money supply. For more than two decades this line has
been nearly horizontal within a few percent of zero. It is currently
(as at January-2015) at 3.4%. So, why didn't the dramatic increase
in the MB during the early 2000s have a significant effect on the
money supply and why hasn't the even more dramatic increase in the
MB over the past two years had a significant effect on the money
supply?
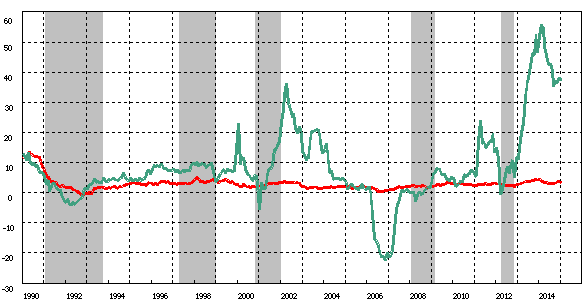
Chart Source: Bank of Japan
We wish we knew the answer. Here's
what we do know:
1) The Bank of Japan (BOJ) is not 'sterilising' its asset
monetisation. In other words, the BOJ is not selling assets to
negate the effect that its asset purchases would otherwise have on
the money supply. Why would it, when the express intention of the
asset purchases is to increase the Yen supply?
As an aside, a central bank will sterilise its asset monetisation in
the case where it wants to elevate the price of a particular asset
without increasing the monetary inflation rate.
2) The mechanics of the BOJ's QE are different to the mechanics of
the Fed's QE. For every dollar of QE (asset monetisation) carried
out by the Fed, one dollar gets added to the US money supply. Anyone
who says otherwise, for example, anyone who says that the Fed's QE
adds to bank reserves but not the economy-wide money supply, does
not understand the mechanics of QE as practiced in the US.
3) There is widespread belief that the BOJ's massive QE program and
the resultant moonshot in Japan's monetary base caused a massive
increase in the supply of Yen. Although this belief is unfounded, it
has helped bring about a large multi-year decline in the Yen's value
on the foreign exchange market.
4) Because the Yen's decline on the foreign exchange market has not
been supported by a decline in its domestic purchasing power (the
Yen's ability to maintain its domestic purchasing power is not a
mystery to anyone who knows the actual money-supply situation), the
Yen is now very under-valued relative to the US$ and most other
currencies.
The Stock Market
Over the first three days of this week the US stock market
managed to do as little as it needed to do to avoid providing any clues as to
the likely direction of the next multi-week trend. The situation is interesting,
though, because both the S&P500 Large-Cap Index and the Russell2000 Small-Cap
Index are just below intermediate-term resistance levels.
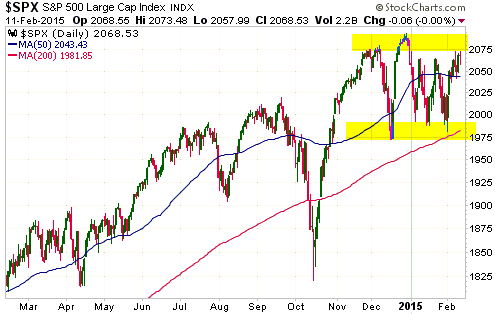
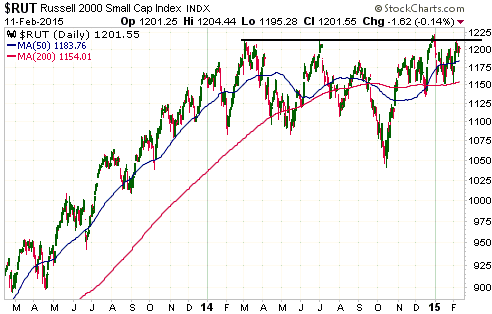
Given on our longer-term bearish outlook, two short-term scenarios are equally
plausible. One is that the market has already made a major top and will soon
begin to trend downward. The other is that the market will make a new high
within the next few weeks, but will reverse lower and commence a 1-2 year
bearish trend shortly after making the new high. This would be similar to how
the NYSE Composite Index peaked during 2000 and how several indices peaked
during 2007.
Gold and the Dollar
Gold
In terms of time, gold's correction is probably still closer to the beginning
than the end.
In price terms it could be a different story, although the fact that gold has
just broken below its 50-day MA during what is probably the initial phase of a
multi-phase correction opens up the possibility that the November-2014 bottom
will be tested before the correction comes to an end. As outlined in our Yearly
Forecast*, this possibility will become the most probable outcome if the senior
US stock indices break above last year's highs during the weeks ahead.
The $1250 level has acted as support and resistance at various times over the
past 12 months. It has again become resistance and is a likely target for the
next rebound, regardless of whether the rebound begins immediately or following
some additional weakness.
*From the "Gold" section of our 2015 Yearly Forecast: "If
the S&P500 is in the process of rolling over to the downside on a long-term
basis then it's highly probable that gold bottomed last November and will
generate the sort of performance in 2015 that we originally expected to happen
in 2014. That is, gold will probably work its way higher over the course of this
year with a top most likely occurring in the $1400s and with an outside chance
of making it as high as $1600. The most plausible alternative is that the S&P500
will make some additional headway over the next few months and gold will drop to
test its 2014 bottom during the second quarter of this year prior to a long-term
reversal."
Gold Stocks
Why gold-mining stocks are going to outperform gold bullion this year
The gold-mining sector has a reputation for leveraging gold's returns during
periods when the gold price is rising. This reputation is undeserved, not only
because the gold-mining sector under-performed gold bullion during many
multi-quarter periods of gold-price strength over the past 50 years, but also
because there is no good reason to expect gold-mining stocks to leverage gains
in the gold price unless the gains in the gold price are at least matched by
gains in gold-mining profit margins. For this to happen, the dollar price of
gold must rise by more than the total dollar cost of gold production.
It therefore shouldn't be assumed that gold-mining stocks will necessarily rise
by more than, or even by as much as, the gold price. However, both history and
logic tell us that gold-mining stocks should handily outperform gold bullion
during periods when the starting gold-stock valuation is relatively low and
there is an expansion in gold-mining profit margins due to the gold price rising
relative to the total cost of gold production.
Using the gold/oil ratio as a proxy for gold-mining profit margins, the
following chart shows how the HUI/gold ratio has responded over the past 15
years to changes in the profitability of gold mining.
Of main interest are the two periods within the boxes drawn on the chart. These
boxed periods extend from the start of a large up-move in the gold/oil ratio
until two years after the gold/oil ratio reached a major peak. In the first case
(2000-2003), the HUI/gold ratio began trending upward as soon as the gold/oil
ratio began to rally and didn't peak until two years after the peak in gold/oil.
In the second case (2008-2011), the HUI/gold ratio was in crash mode and at a
relatively high level when the gold/oil ratio began to rally. It therefore
didn't immediately react in a positive way to the gold/oil rally. Instead, it
plunged to a low level before starting to trend upward. It peaked about 8 months
after the peak in gold/oil, but remained near its high until two years after the
peak in gold/oil.
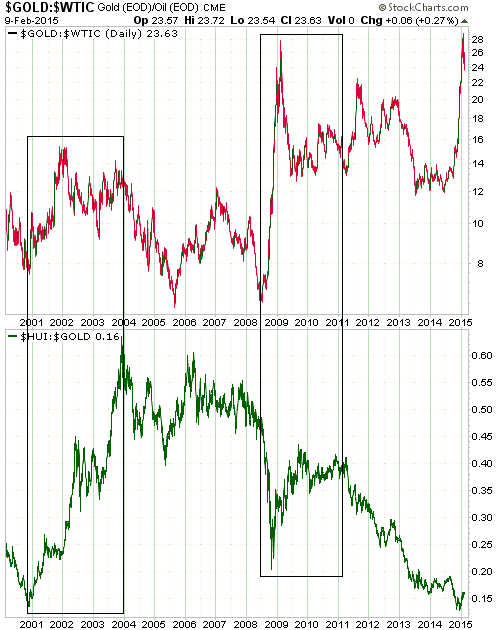
Over the past several months we've had a huge rise in the gold/oil ratio and an
up-turn in the HUI/gold ratio from a very low level about two months after the
start of gold/oil's accelerated rise. Based on the tendency for HUI/gold rallies
to continue for a "considerable period" after a major peak in the gold/oil ratio
and the tendency for the cost of gold mining to follow the gold price with a lag
of 1-2 years, as long as the gold price does no worse than hold its ground we
can reasonably expect gold-mining profit margins to trend upward over the coming
1-2 years and for gold-mining stocks to outperform gold bullion over the course
of this year. They are also likely to outperform next year, but there's no point
looking that far ahead.
Current Market Situation
The HUI remains in correction mode and is probably headed for support at around
180.
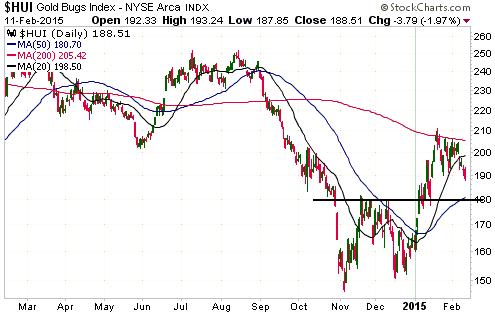
The HUI has held up relatively well during the course of gold's 2-3 week
decline. For example, whereas gold bullion broke below its 50-day MA on
Wednesday 11th February, the HUI is still comfortably above its 50-day MA. Due
to improving gold-mining profit margins, the relatively good performance should
continue.
The Currency Market
During the first half of January we said that the days around the 22nd January
ECB meeting (the date when the ECB's new QE program was due to be introduced)
made a likely time-window for short-term trend reversals. The two markets that
trended most strongly into that window were the currency market (in particular,
the euro and the Dollar Index) and the gold market.
The gold market made its intra-day high for the year of $1307.80 on 22nd January
and has since done enough to confirm that a short-term trend reversal occurred
at that time. The euro made its intra-day low for the year of 111.6 on 23rd
January but has not yet done enough to confirm that a short-term trend reversal
occurred at that time. A daily close above 115 would signal a short-term trend
change.
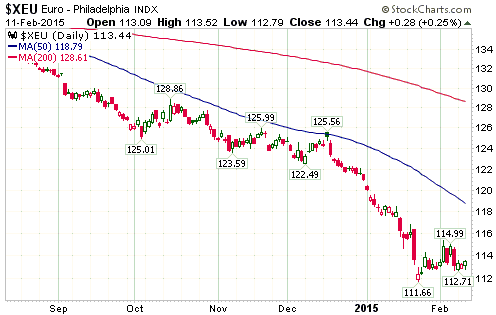
Downward pressure is being maintained on the euro, preventing it from signaling
an upward reversal of its short-term trend, by the debt/bailout negotiations
between the government of Greece and the other euro-zone governments. Although
28th February is supposed to be a deadline for something to be resolved, we
won't be surprised if these negotiations drag on for months in true EU
tradition.
The reality is that the Greek government should have defaulted on its debt years
ago, resulting in large losses for the holders of Greek government bonds and a
vastly reduced debt burden. Instead, the short-term cost of the debt was reduced
while the size of the burden was greatly increased in what has come to be called
"extend and pretend".
According to the new Greek government, the time for pretending is over. It's
time for the EU's senior politicians and central bankers to come to terms with
the reality that the Greek government is insolvent.
Updates
on Stock Selections
Notes: 1) To review the complete list of current TSI stock selections, logon at
http://www.speculative-investor.com/new/market_logon.asp
and then click on "Stock Selections" in the menu. When at the Stock
Selections page, click on a stock's symbol to bring-up an archive of
our comments on the stock in question. 2) The Small Stock Watch List is
located at http://www.speculative-investor.com/new/smallstockwatch.html
 McEwen
Mining (MUX). Shares: 300M issued, 305M fully diluted. Recent price: US$1.03 McEwen
Mining (MUX). Shares: 300M issued, 305M fully diluted. Recent price: US$1.03
We added MUX, a junior miner with gold, silver and copper assets, to the TSI
Stocks List via the
email sent
to subscribers after the close of trading on 10th February. The price at the
time was the same as the current price.
The following chart shows how the stock has performed over the past three years.
Despite being over-priced relative to its assets, the stock held up quite well
and was still trading above US$3 in the middle of last year. However, it
collapsed from a high of $3.19 last July to a low of only US$0.90 last December.
It then rebounded to US$1.40 before pulling back to its current level of
US$1.03. A test of the December low is certainly possible over the weeks
immediately ahead, but, as discussed in our 10th February email, its current
value and its growth potential make it a good candidate for new buying in the
low-US$1 area.
In 2015 MUX is expected to have gold-equivalent (gold plus silver) production of
140K ounces from its operating mines in Mexico (El Gallo 1) and Argentina (San
Jose). In the current market this production is probably worth somewhere between
$1000 and $1500 per ounce, or between $140M and $210M.
MUX also has some potentially valuable exploration-stage assets, chief among
them being:
1) The El Gallo 2 silver project in Mexico
It is estimated that at a cost of $150M this project could be developed into a
mine that produces 5.2M ounces of silver per year. However, it probably won't
make economic sense to build the mine until silver moves up to $24/oz. In the
mean time we assign this project's 64M-oz M&I silver resource an option value of
$25M.
2) The Gold Bar project in Nevada
A PFS completed in November-2011 estimated that this project's 500K-oz gold
deposit could be developed into a 50K-oz/year mine at a cost of $53M. At
$1300/oz the project's NPV(8%) and IRR were calculated to be $45M and 34%,
respectively.
Considering that operating costs should be lower now than they were in
November-2011, we suspect that this project will be developed into a mine during
2016-2017 (the permitting process is scheduled to be complete in 2016).
Our valuation at this time is $23M (half of the calculated NPV).
3) The Los Azules copper project in Argentina
This project contains a massive, low-grade copper deposit. The total copper
resource (all categories) is 19.7 BILLION pounds.
A PEA completed in November-2013 estimated that at an assumed copper price of
US$3.00 the project would have an NPV(8%) and IRR of $1.7B and 14.3%,
respectively. The problem is that the PEA also estimated an initial capex of
$3.9B.
The potential value of Los Azules probably explains why MUX was such an
expensive stock for so long. The thing is, nobody is going to spend $3.9B to
build a mine in Argentina with an IRR of 14.3%, so even at a copper price of
$3.00/pound this project would have no chance of progressing to the construction
phase or attracting a substantial offer from a large mining company.
However, Los Azules does have some option value at the current copper price and
will probably be assigned significant value by the stock market when the copper
price moves back above $3/pound. In our opinion, right now Los Azules is only
worth about $30M, but, based on the price that was paid for Lumina Copper's
Argentina-based copper deposit last year, will be worth $300M when the copper
price recovers to $3.00-$3.20.
So, at current metal prices and in the current depressed market environment, we
think that fair value for MUX is: $140M-$210M for the producing assets + $25M
for El Gallo 2 plus $23M for Gold Bar + $30M for Los Azules = US$218M-$288M. The
stock's current enterprise value is US$280M, which means that MUX is currently
not a bargain. However, our estimate of fair value will rise quickly when metal
prices begin to trend upward.
At today's price MUX offers substantial leverage to upside in gold, silver and
copper prices, with downside limited by a portfolio of conservatively-valued
assets.
Chart Sources
Charts appearing in today's commentary
are courtesy of:
http://stockcharts.com/index.html

|
