![]()
![]()
![]()
![]()
- Interim Update 11th March 2020
Copyright
Reminder
The commentaries that appear at TSI
may not be distributed, in full or in part, without our written permission.
In particular, please note that the posting of extracts from TSI commentaries
at other web sites or providing links to TSI commentaries at other web
sites (for example, at discussion boards) without our written permission
is prohibited.
We reserve the right to immediately
terminate the subscription of any TSI subscriber who distributes the TSI
commentaries without our written permission.
The Oil Crash
The governments of Saudi Arabia
and Russia, the world's two largest oil exporting countries, have decided
to 'play chicken' with each other regarding oil supply and pricing. This
caused a spectacular decline in the oil price on Monday 9th March.

The physical supply-demand situation in the oil market, as indicated
by the term structure of the futures market, was bullish (for the oil
price) as recently as two months ago. Unsurprisingly, considering the
games being played by the biggest oil exporters and the
coronavirus-related reduction in demand, the term structure of the futures
market now points to a bearish physical supply-demand situation. For
example, crude oil for delivery in April-2020 is, as we write, trading at
a 15% discount to crude oil for delivery in April-2021. This is indicative
of a market with abundant short-term supply.
However, the oil price
has reacted so violently to the bearish shift in fundamentals that the 9th
March low of around $27 could be the ultimate low.
Regardless of
whether or not Monday's low marked the end of the 2020 oil crash, over the
past few days many oil-and-gas (O&G) equities have traded at price levels
and through price ranges that can be aptly described as insane.
The
trading of Enable Midstream Partners (ENBL), the stock that we added to
the TSI List at US$3.40 during the early going on Monday 9th March, is an
excellent example. The stock ended last week at US$5.00, at which point
its distribution yield was already extremely high at around 26%. On Monday
it traded as low as (and closed at) US$1.86, giving it a distribution
yield of 71%! On Tuesday it gained 154% (!!) to close at US$4.73 and on
Wednesday it gained another 8% to close at around US$5.00. So, over the
first three days of this week ENBL went from $5.00 to $1.86 and back to
$5.00.
ENBL operates a boring natural-gas transportation business
with annual sales of about US$3B and consistent positive cash flow. Its
market value should not be swinging wildly from day to day. Clearly,
believers in the Efficient Market Hypothesis do not have much in the way
of real-life market experience.
The O&G sector now offers one of
the best buying opportunities we have ever seen. Some stocks have
rebounded strongly from Monday's extremes, but most are languishing
at/near historic lows. However, that doesn't mean you should be 'backing
up the truck'. There's never any way to know, in advance, how irrational
things will become on either the upside or the downside before
common-sense and level-headed value investing start to gain the upper
hand, so it is almost always prudent to change market positioning
methodically over time.
The Inflation
Expectations Crash
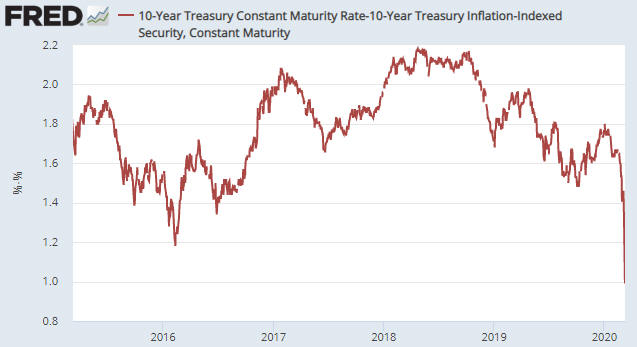
Inflation expectations have
crashed along with the stock market and the oil price. This is evidenced
by the following chart of the "Expected CPI", where the Expected CPI is
calculated by subtracting the 10-year TIPS yield from the 10-year T-Note
yield. Since the advent of the TIPS market in 2003, the Expected CPI was
only below this week's low during the final few months of 2008 and the
first few months of 2009.
The collapse in inflation expectations over the past several weeks
does not indicate that "inflation" will be much lower in the future. On
the contrary, it makes higher "inflation" more likely.
Over the
next few months the CPI will be lower than would have been the case in the
absence of the coronavirus-related restrictions to economic activity and
the plunge in the oil price, but by this time next year the CPI probably
will be much higher due to the following:
1) Aggressive central
bank reactions to the economic slowdown and the stock market plunge. These
reactions will distort prices and hamper the economy, but to a man with
nothing except a hammer every problem looks like a nail. To a central
banker, every economic problem other than obvious "price inflation" looks
like a reason to create more money out of nothing. Also, to the central
bankers of the world the recent rapid decline in inflation expectations is
like a giant cattle prod that very quickly will push them further in the
direction of pro-inflation monetary policy.
2) In addition to
aggressive monetary stimulus there will be aggressive fiscal stimulus.
This would be the case anyway under such circumstances, but in the US the
short-term stimulus from increased government spending will be more
aggressive than usual due to Trump's fear that economic weakness will
spoil his chance of winning a second term.
3) Once the coronavirus
threat dissipates, there will be the natural release of pent-up demand.
Adding the natural force of pent-up demand release to the unnatural
forces of monetary and fiscal stimulus should mean that "inflation" will
be materially higher a year from now than would have been the case in the
absence of the Q1-2020 calamity. Our prediction: During the first half of
2021 the official US CPI, which routinely understates the increase in the
cost of living, will print above 4%.
The Stock Market
The discussion of the current
stock market situation included in the email we sent to subscribers in
response to Monday's market drama remains applicable and therefore is
repeated herewith:
"We have been expecting a test or breach of
the 28th February low (around 2850 for the SPX), but not as soon as this
week. In broad-brush terms, the expected pattern involved 1) an initial
extreme, 2) a choppy multi-week rebound that retraced about half of the
initial decline, and 3) another leg down that either successfully tested
or decisively breached the price at the initial extreme. The time from the
initial extreme to the final low is usually 5-8 weeks, which is why we
wrote in the latest Weekly Update that a decline this week that resulted
in a daily close below the 28th February low would be a significant
deviation from the expected pattern.
Due to adding the news over
the weekend of an 'oil price war' between Saudi Arabia and Russia, the
world's two largest oil-exporting countries, to the on-going stream of
negative news regarding the coronavirus, the stock market crashed anew on
Monday 9th March and the SPX closed about 100 points (3.5%) below its 28th
February low. Furthermore, there was sufficient market-wide panic on
Monday 9th March to drive several technical indicators beyond the extreme
levels reached on 28th February. For example, on Monday there was an
8-year low in the NASDAQ McClellan Oscillator, an 11-year high in the VIX,
a rise in the gold/silver ratio to test its 70-year high near 100, and the
second-largest number ever of individual NASDAQ stocks making new 52-week
lows on a single day.
This suggests that 28th February wasn't the
initial extreme. Instead, it looks like the initial extreme will be put in
place this week. There should then be a volatile multi-week rebound
followed by a decline that tests (or breaches) this week's low."
Although the SPX traded at a new low for the year on Wednesday 11th
March, the indicators mentioned in our email have not exceeded Monday's
extremes. Here are charts illustrating three of the most significant
extremes.
The first chart shows the 8-year low registered by the
NASDAQ McClellan Oscillator on Monday 9th March.
The next chart shows Monday's post-GFC VIX high.
The final chart shows the daily number of individual NASDAQ stocks
making new 52-week lows. As mentioned in our email earlier this week,
there has been only one day in history when the number of individual
NASDAQ stocks making a new 52-week low was greater than it was on Monday
9th March 2020. That day was in October of 2008, near the crescendo of the
Global Financial Crisis (GFC).
In our email earlier this week we concluded: "...it looks like the
initial extreme will be put in place this week. There should then be a
volatile multi-week rebound followed by a decline that tests (or breaches)
this week's low."
Does this week's low have to be tested?
No, it doesn't have to be, but it's rare for a major 'oversold'
extreme not to be tested. The following chart of the NYSE Composite Index
(NYA) shows that even the October-1987 crash low was tested several weeks
later, and the market was more stretched to the downside and a lot cheaper
at the 1987 crash low than it was at this week's low.
Significantly, in 1987 the majority of NYSE-traded stocks made their lows
for the year during the October crash, even though the NYA made a new low
for the year in December. That's normal. The implication is that the
majority of stocks could well have made their correction lows during the
first half of this week even if the senior indices are destined to make
lower lows within the next several weeks.
The stage is set for the extreme volatility to continue over the final
two trading days of this week. As we write, S&P500 futures are more than
100 points lower and Dow futures are more than 1,000 points lower in
reaction to Trump's announcement that travel from Europe to the US will be
suspended starting on Friday.
Gold and the Dollar
Gold and Silver
The Ratio
During periods when
economic confidence plunges, the gold/silver ratio acts like a credit
spread. Since early-January and specially since mid-February, economic
confidence has plunged and credit spreads have widened substantially.
Consequently, it isn't surprising that the gold/silver ratio has moved
sharply higher.
Here is a chart that illustrates what we just
described. On this chart the black line is a credit-spread proxy and the
gold line is the gold/silver ratio.
In other words, over the past two months silver has performed the way
it is 'supposed to' relative to gold. When the crisis abates and economic
confidence begins to rebound, the silver price will rebound relative to
the gold price.
The Recent Price Action
The US$ gold price has pulled back a little, but it is still close to
a 7-year high. It could chop around at a high level for as long as the
fundamental backdrop remains very supportive, which could mean a few more
days or few more weeks or even two more months. It could even make a new
multi-year high, although any new high within the next couple of months
probably would be marginal. However, at some point in the not-too-distant
future the panic regarding the coronavirus will subside and the huge
speculative net-long position in the gold market will start being unwound.
We suspect that this will result in the gold price declining to around the
mid-$1400s, although the magnitude of the correction will be determined in
part by how quickly the speculative net-long position shrinks.
Even though the US$ gold price is close to its recent 7-year high, the
US$ silver price is close to a 7-month low and looks set to fall further.
The recent disparity between the performances of gold and silver is
consistent with the overall financial/economic backdrop, but it has
emphasised a non-confirmation that has bearish implications for both
metals. The non-confirmation was discussed in the 10th February and 17th
February Weekly Updates, and was formed by the following sequence:
1) Large multi-month rallies in the prices of both metals.
2)
Significant short-term corrections in both markets.
3) A rally to a
new high in the gold price accompanied by a rally to a lower high in the
silver price.
This sequence has been seen around a few important
tops for the metals, including the 2011 top and -- perhaps more relevantly
given what's happening in the stock market -- the 1987 top.
We
suspect that silver will make a multi-month bottom in the $15.50-$16.50
range within the next few weeks, which implies that we aren't expecting a
lot more downside. However, the historical pattern following bearish
gold-silver non-confirmations of the type that occurred over the past six
months suggests that after the current decline reaches its end there will
be a long period of range trading between the February-2020 top and the
March-April-2020 bottom.
Gold Stocks
The
gold mining sector again plunged with the broad stock market on Wednesday
11th March. The HUI is now down by about 20% since its 24th February top
and has just closed below its 200-day MA for the first time since May of
last year.
In nominal dollar terms the HUI is not yet 'oversold', even on a
short-term basis. However, in gold terms it definitely is. This is
evidenced by the following chart, which shows that the HUI/gold ratio has
just dropped to the bottom of a 15% envelope around its 40-day MA. The
HUI/gold ratio hasn't been this stretched to the downside since the
multi-year bottom in Q3-2018.
The HUI has support at 200 (that is, near the current level) and then
180. We suspect that the lower of these support levels defines the
near-term risk.
We think that the gold mining sector is in a
similar position to silver. It probably isn't far from a short-term
bottom, but there isn't a good reason to expect that a rally to above the
February-2020 high will happen anytime soon. Instead, several months of
range trading between the February-2020 high and whatever low is put in
place during March-April is likely. This is the probable response to
conflicting forces, with the gold mining stocks being helped by
stabilisation in the broad stock market and hurt by the decline in the
gold price that is bound to occur after economic confidence starts to
recover.
The Currency Market
The Dollar
Index (DX) probably is in the early part of an intermediate-term downward
trend. However, at the end of last week it was short-term 'oversold' and
seemingly poised for a 1-2 week rebound.
The DX became more
'oversold' when it plunged to a 12-month low on Monday 9th March, but it
then began to rebound. In the latest Weekly Update we noted that a routine
correction could take the DX up to around 97.5, which is about one point
above Wednesday's close. Both the 50-day MA and the 200-day MA are near
97.5.
Updates on Stock Selections
Notes: 1) To review the complete list of current TSI stock selections, logon at
http://www.speculative-investor.com/new/market_logon.asp
and then click on "Stock Selections" in the menu. When at the Stock
Selections page, click on a stock's symbol to bring-up an archive of
our comments on the stock in question. 2) The Small Stock Watch List is
located at http://www.speculative-investor.com/new/smallstockwatch.html
![]() In
the latest Weekly Update we wrote about Adriatic Metals (ASX: ADT). Our
plan was to add the stock to the TSI List if it traded at A$1.10.
In
the latest Weekly Update we wrote about Adriatic Metals (ASX: ADT). Our
plan was to add the stock to the TSI List if it traded at A$1.10.
In sympathy with another general panic out of equities the stock traded as
low as A$1.00 in the Australian market today and closed at A$1.01, so it
has been added to the List at A$1.10.
Chart Sources
Charts appearing in today's commentary
are courtesy of:
https://stockcharts.com/
http://bigcharts.marketwatch.com/
https://research.stlouisfed.org/
![]()