|
- 11 April 2001
Bonds and
Inflation
Bond Market Update
We have been medium-term bearish on
bonds since the beginning of this year on the basis that the huge on-going
increase in the money supply (inflation) and the absence of economic 'slack'
(energy prices remain high) will put irresistible upward pressure on long-term
interest rates. We turned short-term bearish on bonds at the end of February
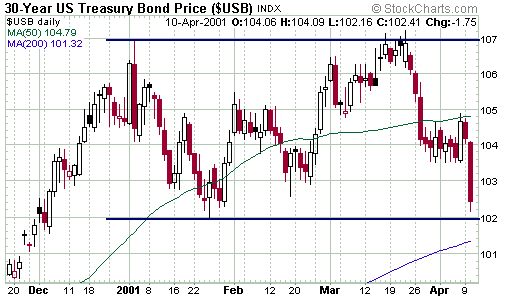
on the basis that a pullback was likely (the T-bond price has subsequently
fallen from 106 to 102.4, pushing the yield from 5.31% to 5.62%).
While we remain short-term bearish
at this time, our expectation has been that one final surge to new highs
would occur before the rot sets in (the chart projection included in the
Mar-26 WMU showed a drop in the bond price during the first half of April,
an upward spike in late-April/early-May, and then a major sell-off). This
expectation (for one final surge) was based on a) the relationship between
T-Bonds and the A$ (the A$ and US bond yields consistently move in the
same direction, with the A$ leading at major turning points), and b) a
belief that a combination of weak economic data and a jittery stock market
would provide some support to bond prices until early May.
A few things are, however, casting
some doubt as to whether new highs for bond prices (new lows for bond yields)
will actually materialise.
Firstly, the move to new lows by the
A$ during March was followed by marginal new lows in the T-Bond yield.
It could therefore be argued that bonds have already fulfilled their potential
as forecast by this inter-market relationship.
Secondly, the oil price has held important
support during pullbacks and has just broken out above its short-term downtrend.
Below is an updated version of the chart included in last week's IU that
shows yesterday's upside breakout. Since the oil price and the bond price
tend to move in opposite directions, new highs in bonds are less likely
to occur when the oil price is strong.
Thirdly, an official (inter-meeting)
rate cut in the near-term, something that appears quite likely, would potentially
put a concrete floor under the equity market and cause long-term market
interest rates to move higher (as the market discounts future inflation).
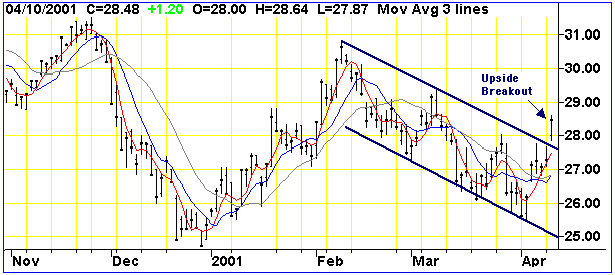
Fourthly, although the recent decline
in bonds has been in-line with our short-term forecast, bonds have reached
an area of critical support and must reverse higher very soon if they are
to have any chance of moving to new highs over the next month. The following
chart indicates the T-Bond's trading range since the beginning of this
year. A weekly close below the bottom of this range would strongly suggest
that the peak is in place.
Bonds still have the potential to rally
during the second half of April, but until we see some evidence that a
rally has commenced we will retain our short-term bearish view. Regardless
of whether or not we get an upward spike over the coming month, we are
confident that bond prices will move substantially lower over the coming
6-12 months.
Inflation
Regular readers would be well aware
that we have been consistent in our view that US inflation is in a major
up-trend. The only question, as far as we are concerned, is whether the
trend towards higher inflation began in 1995 (when the year-over-year M2
growth rate bottomed and began moving higher) or in 1998 (when bond prices
peaked). The surge in the money supply growth over the past several months
is just another stage in this inflationary trend.
At some point the effects of this inflation,
such as a reduction in the purchasing power of the Dollar, will begin to
be factored into market interest rates (the inability of T-Bond futures
to achieve a daily close above their Jan-03 high may mean that the market
has already begun to factor-in these effects). However, although the results
of high inflation always include reduced real economic growth and high
unemployment, we don't see any other politically-acceptable path for the
US. Consumer and corporate debt levels are so high that the short-term
effects of inflation will always be preferred over the short-term effects
of any substantial slowdown in the rate of money-supply growth (in the
political arena the short-term is all that matters).
The US
Stock Market
Current Market Situation
Since late-March we have been recommending
that subscribers average-into the market during weakness. From the Mar-28
IU:
"Whether the bottom is reached in
April or May, it is our belief that we are approaching the first investment-grade
buying opportunity in years. By 'investment-grade' we mean an opportunity
to buy stocks with the idea of holding for at least 6 months rather than
for just a quick trade."
And...
"Since buying at THE bottom will
require more good luck than good judgement, we think the best approach
to this unfolding investment-grade buying opportunity is to scale-in over
the next 6 weeks. The lowest-risk way to do this is to accumulate the NASDAQ100
tracking stock (QQQ) during weakness over the next several weeks."
At this stage we have made two purchases
of QQQ for an average cost of about $36. We also purchased Corning (GLW)
at $20. We plan to continue accumulating QQQ on pullbacks into the $33-$37
range and to purchase North American Palladium (PDL.TO) if it becomes available
under C$11. Palladium producer PDL fits nicely into our 'higher inflation'
theme, particularly since there is a long-term shortage of palladium.
We are yet to see the evidence we have
been watching for to confirm that a major bottom is in place. In particular,
we doubt that a major bottom will occur until after a dramatic loss of
confidence is signaled by a sharp fall in the Dollar and rise in the gold
price. Furthermore, although long-term market interest rates moved up quite
sharply on Tuesday we have not yet seen an upward reversal in short-term
rates (as discussed in the latest WMU this is something we expect to see
as soon as the crisis ends). Until we do see such evidence we will assume
that any rally is of the 'counter-trend' variety. However, counter-trend
rallies can sometimes extend for many months and generate large percentage
gains.
Gold and
the Dollar
Current Market Situation
After a market has confirmed strength
or weakness it will often immediately make a brief move in the opposite
direction. This is just the market doing what it does best - act in a way
that confuses the greatest number of people. As such, traders who react
to mechanical signals and buy as soon as a market confirms strength, or
sell as soon as a market confirms weakness, will regularly find themselves
buying at short-term peaks or selling at short-term troughs.
The bounce in the Dollar Index during
the first 2 days of this week looks, to us, like the sort of 'curve ball'
the market will often throw after confirming weakness (the Dollar confirmed
weakness by closing below 114.92 last week). If this is the case we should
see the Dollar reverse lower either today or tomorrow. A daily close below
114.51 (basis the June contract) would provide strong evidence that at
least a short-term downtrend is underway.
As far as our bearish view on the Dollar
is concerned, we are encouraged by the strength in the A$ since the beginning
of last week. For the first time since the Greenback peaked in October
of last year we may be about to see all the major currencies moving higher
versus the Dollar (the Dollar's initial decline into its Jan-03 bottom
was lessened by the impact of a weak Yen and the extent of any pullback
over the past 3 months has been reduced by weakness in the commodity currencies
(the A$ and the C$) and the Yen).
One piece of news that will have a
near-term effect on the currency markets is the ECB's decision on interest
rates due later today. By the time you read this the decision will probably
be known, so we won't bother speculating on what they will do. Judging
by the reaction to previous non-moves by the ECB, the market seems to believe
that a rate cut is warranted in order to stimulate economic growth. If
the ECB decides against reducing rates, the euro will probably take another
quick dip before returning to its upward path.
An inherent problem with the euro,
and one of the main reasons we remain long-term bearish on this currency,
is that the ECB cannot possibly fix official interest rates at a level
that suits the requirements of all the economically-disparate participants
in the monetary union. This problem is magnified by the fact that ECB monetary
policy is determined by the consensus of an 18-member committee, with most
members no doubt voting along nationalistic lines.
Gold is yet to provide us with any
technical evidence that a low is in place. As previously noted a daily
close above 261.50 (basis the June contract) is needed for initial confirmation
of a low. Gold stocks appear to be marking time until the gold price finally
takes off.
When gold eventually does rally, a
large percentage of the move will probably happen within a short period
of time. The short position continues to build, the money supply continues
to expand at a frenetic pace, and the Dollar is showing preliminary signs
that a top is in place. The spring is being coiled tighter and tighter.
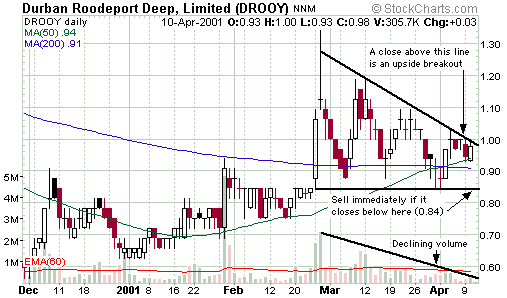
For those who are interested in committing
additional money to the gold sector, Durban Deep (DROOY) is set up very
nicely for a short-term trade (see chart below).
Changes
to the TSI Portfolio
No changes.

|
